FTSE100- June

Fluke said:
KJH and Hooya.
Thank you both for replying to my requests, I really do appreciate your help.
Sorry to be brief but I have to go out now.

regards Jon.
Gee Fluke, and the market is about to put in (intra day charts) one of those XABCD's your working on !!
Let me know when you get back if you spot it.....!
KJH
 
mully

To-days chart and your view of events would be useful. Thank you

Regards

bracke
 
ftse has tried a couple of times to get back above 4500 without success.
Maybe the US opening will provide the fillip required.

Regards

bracke
 
That would be on the assumption the US heads north instead of south for the first hour
 
dc2000

Correct. But it can delay a little while if it wants to.

Bearing in mind interest rate decision tine approaches, the dow may just dawdle untill the decesion is made.

Regards

bracke
 
Bracke,

I am finding the FTSE100 hard work at the moment. (No clear sustainable trends)
Therefore, since I want an easy life I am concentrating
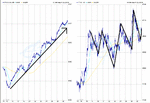
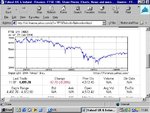
on the FTSE250 which is clearly in a clear up-trend since 17/05/04. (see attachment)

As you know you cannot directly play that index,
so have resorted to the underlying stocks/equivalents.

The moment the FTSE100 starts to show trending characteristics I will show more interest.

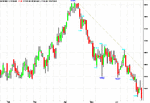
In my weekly review I posted a clear overlapping FTSE100 daily chart with clearly defined support/resistance lines. I said it was not the most bullish chart. However, the one positive was the upward sloping trendline.

Also, since the 23/06/2004 FTSE100 has made three higher highs and three higher lows
which appears to support the rising trendline... but it is making heavy weather of it all.

BUT turn to the FTSE250 and matters appear much clearer. (I think it gives a truer picture of what UKplc is doing as opposed to what BP, VOD, HSBS & GSK are doing!!!)

Since the FTSE100 bottomed on the 17/05, it has risen +2.6% up to the close last night,
compared to +6.8% for the FTSE250. The 4 global titans, which do much to distort the FTSE100, over the same period recorded

BP -0.6%
VOD -7.7%
HSBC +3.9%
GSK -1.6%

But that is nothing compared to my watchlist /trades, since 17/05/04, which comprises both FTSE100 and FTSE250 constituents:

ARM +16.9%
SPT +23.9%
WLF +28.4%

BAY +12.0%
CS +37.3%
ICI +21.6%
RTR +15.7%
RR +16.7%
UBM +26.1%

So I apologise for my lack of contributions, but my focus has been elsewhere(individual stocks).

I dont believe in making comments when I have nothing to contribute.

Your question re by implied bullishness is valid. My positive slant/view is based on the fact that I am making money currently in stocks as opposed to the index.

Hope this helps.
 

Attachments

  • chart.gif
    chart.gif
    38 KB · Views: 219
Last edited:
mully

Thank you for your post

So its onward and upward for the ftse250 and not too steady as she goes for the ftse100.

I know that you trade what you see but you must have some thoughts on what will push the ftse on.
Would it be reasonable to imagine ( I picked that word with care ) that IF the interest rate rise in the US is held to a 0.25% increase the market will heave a sigh of relief and that the dow will rise and take the ftse with it. ?


May I ask how you decided which companies to place on your watchlist ?


Regards

bracke
 
mully

"The trite reply is "more buyers than sellers""

Trite dosen't become you, a little more detail would be appreciated.

Regards

bracke
 
Seriously,

You thoughts are all valid and worthy.

However, it is not facts, but PERCEPTION of those facts that count.

I cannot attempt to work out what people are thinking/hoping for.

All I can do is watch what the market is saying.

Is it recording higher highs/higher lows

Is it respecting support levels etc..

Having spent 23 years in the heart of the city I am well versed in the need for every move to be explained by current facts. I can only quote from someone else

" to unravel and identify the multitudes of 'fundamentals' that could conceivably influence the market, that is, the market participants, is extremely difficult, and to quantify them and analyse their impact and interaction is much more difficult still."

Price is, and has always been, the premier signalling device of the market economy/stock market.


stick to price, and only afterwards find the 'fundamental' to justify the move.
 
undefined
KJH said:
Gee Fluke, and the market is about to put in (intra day charts) one of those XABCD's your working on !!
Let me know when you get back if you spot it.....!
KJH

I have attached a chart showing the onky XABCD formayion I can see,Is this the one you refer to?
 

Attachments

  • XABCD.gif
    XABCD.gif
    20.6 KB · Views: 192
Last edited:
Fluke said:
undefined

I have attached a chart showing the onky XABCD formayion I can see,Is this the one you refer to?

Hi Fluke,
Have a look (also) and see what you come up with starting 'X' at your A point, A at your B point ect projected to yesterday low and see what you think of the relationship between the New A & D points ( D being yesterdays low of 4492)

In my mind there is no right answer......just a lot of probabilities, and they are all after the fact.
Now, some of these can be helpful for position traders who are taking a long term (weeks) view but for intra day stuff it's all over the time I've worked it out....! ( for me at least)
I much prefer to look at relationships between expanding or contracting ranges (swings) to help me assess whether the market is expanding contracting or reversing...
What are your thoughts Fluke.
KJH.
 
Morning all,

All quiet ahead of the big announcement from the Fed to-night (7.15pm London time).

The devil will be in the detail of the words that accompany the rate change. Will he use "measured" again to describe the future moves.

Anyboby watching BAY as it reacts to the falling oil price?

And keep on watching my favoured FTSE250 (up 0.21% so far to-day)
 
KJH.
Thanks for making this subject interesting for me.I will have a look at the chart later re jigged as you suggest and come back to you later to day with my thoughts.
 
Another interesting stock to watch is Man Group (EMG)

It just keeps on slipping.
(to coin a catholic term) Is it the outward sign of inner turmoil for the Hedge Fund industry?

I know it has been difficult for them this year given equity market movements.
 

Attachments

  • chart.gif
    chart.gif
    22.4 KB · Views: 203
mully

Thank you for your reply

"stick to price, and only afterwards find the 'fundamental' to justify the move"

I can't argue with that.

btw you did not say how you decide what companies to put on your watchlist, if you do not reply I will presume it is classified information.

Regards

bracke
 
To-Days Pivot 4507
R1=4523
R2=4535
R3=4550

S1=4496
S2=4481
S3=4469

Regards

bracke
 
bracke

i tried to pm you with a full explaination to your question,
but you appear not to want private e-mails.

So I leave it in your hands.
 
Following mully's comments relating to the ftse 100 & 250 I thought that the charts for the last 5 years might be of interest.

Regards

bracke
 

Attachments

  • untitled.jpg
    untitled.jpg
    74.3 KB · Views: 180
  • untitled 2.jpg
    untitled 2.jpg
    73.5 KB · Views: 172
Top