FTSE100 day trading journal

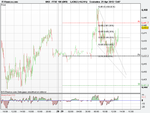
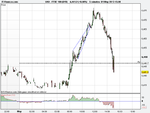
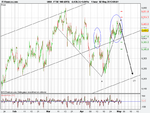
Falling wedge hit the target 6439.

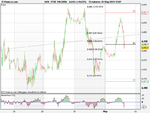
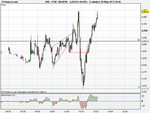
I would like to have seen another touch of the bottom line of the wedge formation but because the lows around this area are today's pivot and support, I could not resist a long trade on the break. Moreover a near touch indicates a partial decline which in turn makes the case for a buy.
 

Attachments

  • 29 April 13 5 mins.png
    29 April 13 5 mins.png
    18.8 KB · Views: 199
The obvious trade today was the break below the double top on the 15 minutes chart at 8.45. The flashing clue was the negative divergence of the momentum reading. After the break it was red all the way down. T1 was the meeting point of the trend line and 38% Fib (see chart). I expected a strong bounce here as it would resist breaking below the trend line but the support was not as strong as I expected. There was a second opportunity to enter short as marked on the 5 mins chart – busting of the falling wedge.

It seems to have stalled at 76% Fib of last week’s low and bouncing of S1 which is the area of 62% Fib.

As an observation and adopting Elliot Wave principles are we in the beginning of the “C” corrective wave or 3rd wave of an uptrend resumption? The former means the index is heading to sub 6200 level and the later means it will bounce of the lower trend line on the 1 hour chart and head up. We may have a clue on the weekly chart as the week of 4th and 11th March seems to have formed a “pipe top” formation. Adopting the measure rule of this pattern it gives a price target of 6177. Up, down or sideways? Time will tell of course.
 

Attachments

  • 30 April 13 15 mins.png
    30 April 13 15 mins.png
    15.8 KB · Views: 193
  • 30 April 13 1 hour.png
    30 April 13 1 hour.png
    26.8 KB · Views: 199
  • 30 April 13 5 mins.png
    30 April 13 5 mins.png
    15.5 KB · Views: 178
Busted “rising wedge” winning the day. After yesterday’s fall it climbed to poke just above the 76% Fib and then came the drop. T1 at 6446 taken out.
 

Attachments

  • 1 May 13 5 mins.png
    1 May 13 5 mins.png
    15.4 KB · Views: 197
  • 1 May 13 15 mins.png
    1 May 13 15 mins.png
    17.3 KB · Views: 165
Mr. Fibonacci never fails to amuse me. See how the drop bounces at the 76% mark!
 

Attachments

  • 1 May 13 5 mins 2nd.png
    1 May 13 5 mins 2nd.png
    16.8 KB · Views: 333
Looks like another “head and shoulder” top formation is shaping up on the 1hour and 15 mins chart in its complex version.

The last time this happened and the break below on 15 April carried the index down 120 points. The key support looks like the 6400 mark this time around. Will it be today..tomorrow..who knows but when or if it does then there is a stronger case that we are in a “C” wave correction.
 

Attachments

  • 2 May 13 15 mins.png
    2 May 13 15 mins.png
    22.9 KB · Views: 178
  • 2 May 13 1 hour with H&S.png
    2 May 13 1 hour with H&S.png
    27.2 KB · Views: 189
Double busting of the rising wedge provided an opportunity for a short but owing to the price action after what came out of Draghi’s mouth, I just couldn’t bring myself to short it.
 

Attachments

  • 2 May 13 5 mins.png
    2 May 13 5 mins.png
    16.2 KB · Views: 186
Top