You are using an out of date browser. It may not display this or other websites correctly.
You should upgrade or use an alternative browser.
You should upgrade or use an alternative browser.
Guide me oh thou great Jehovah
Pilgrim through this barren land
I am weak but thou art mighty
Hold me with thy guiding hand
all together now ...............
Bread of heaven , Bread of heaven ...........
.
.
.
.
Feed me till I want no more
lol
I feel better now
Pilgrim through this barren land
I am weak but thou art mighty
Hold me with thy guiding hand
all together now ...............
Bread of heaven , Bread of heaven ...........
.
.
.
.
Feed me till I want no more
lol
I feel better now
Hooya,
Given your injury, some possible reading.
With reference to your 1,2,3 query, it made me go to my 10 metre bank of investment books (Bonsa 😆 ) and pluck out Tony Plummer's Forecasting Financial Markets. He puts forward that "any price movement subdivides into three phases"
He argues that the five way pattern is the exception, caused by the influence of higher-level trends.
It all in the eyes of the beholder. Whatever floats your boat etc...
Hooya said:"we only see what we want to see !"
well in that case I want to see a big flashy red sign pop up at the end of a 3 saying "THIS IS ONLY THE END OF 3 OF 5!!" 🙂 LOL
Davros? Is crock more of a stock or index trader? Still havent come across and index traders course that doesn cost a rediculous amount.
I think we are seeing the end of a wave 4, I'll post the charts later when I'm back up-to-date with the data. On multiple time frames this apears to be the case.
Crock seems to be a stock and index trader - what I liked is he teaches about level 2 and the FTSE. The course looks very interesting and the sample we got was certainly an eye opener. Lots of information on computer trading by the institutions and how to spot these automatic systems dumping/buying stocks at certain price levels. Have a look on his web site in the courses bit, there is a set of example powerpoint slides.
Last edited:
mully
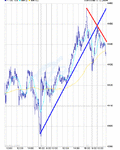
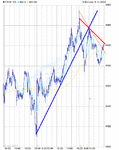
To my untutored eye and as a result of looking at a bonsai chart on another thread ( note immediate blame shift ) does your blue support line show support turned to resistance?
Hooya
Are you giving us the elbow?
Had somrthing similar recently on my knee, if you get the needle just look the other way ,I won't feel a thing.
Regards
bracke
Similar threads
- Replies
- 0
- Views
- 3K
- Replies
- 0
- Views
- 2K
- Replies
- 1
- Views
- 1K


