You are using an out of date browser. It may not display this or other websites correctly.
You should upgrade or use an alternative browser.
You should upgrade or use an alternative browser.
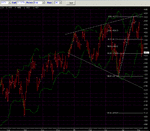
Normally after 3 significant down days with volatility well above the norm I'd expect the bounce to be similar in intensity. The ftse has almost given back all of yesterday's gains and it is looking increasingly like a consolidation at the 50% level of a move back down to the March lows. Support at that level will be critical because failure would complete a double top implying a measured move back down to at least 3981. There is also a widening triangle which indicates instability and is more likely to break to the downside.
Attachments
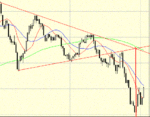
conflicting data today but here is my chart
choice of entries it seems to me
either the 1 day break which was mine or the 3pm express train ?
the RSI tells the story and the a/d had that hang dog look all day
however if Barjon says there is a hammer on the Dow today, we may yet bounce back off the fib at 4412 yet again.
choice of entries it seems to me
either the 1 day break which was mine or the 3pm express train ?
the RSI tells the story and the a/d had that hang dog look all day
however if Barjon says there is a hammer on the Dow today, we may yet bounce back off the fib at 4412 yet again.
Attachments
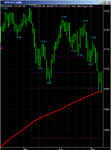
Overnight, we had a classic test of the 200 day MA on the SP500 (see chart) which saw a very impressive rally into the close. Volume was not huge (1694885).
However, the two bugbears: US bond yields still rose 2 bps to 4.81%
and crude oil rose 71 cents to $40.77
This left the D4F FTSE100 quote last night at 4450
indicating a 37 point gain at the opening.
Tokyo, overnight, has fallen 2.95% on oil price fears
D4F now quoting a 25 point gain at opening.
However, the two bugbears: US bond yields still rose 2 bps to 4.81%
and crude oil rose 71 cents to $40.77
This left the D4F FTSE100 quote last night at 4450
indicating a 37 point gain at the opening.
Tokyo, overnight, has fallen 2.95% on oil price fears
D4F now quoting a 25 point gain at opening.
Attachments
Still trying to get a handle on this market.
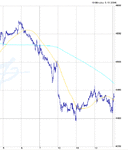
Timeframe: 5 days (see chart)
Is the rally, started on 11/05, just retracing the previous fall?
or is it the start of a new impulsive move to new highs and
the move from the top (4602) can therefore be read as a complete ABC?
Looking at the move from the 5/05-11/05
the rally =60 points or 33% of the previous 178.5 point fall.
That is not an impressive performance so far.
A sign of a strong performance is a retracement of 50%+
This suggests a weak move (so far).
One conclusion is that the move is more a retracement
than the start of a new move to new highs?
Comments welcome
Attachments
Similar threads
- Replies
- 0
- Views
- 3K
- Replies
- 0
- Views
- 2K
- Replies
- 1
- Views
- 1K


