You are using an out of date browser. It may not display this or other websites correctly.
You should upgrade or use an alternative browser.
You should upgrade or use an alternative browser.
Current Advanced Get FTSE100 weekly
Here is something for fun.
Just to prove we all go through the process of buying
expensive Holy Grails systems (it looked pretty) at some stage in our trading lives,
before returning to plain simple vanilla price watching.
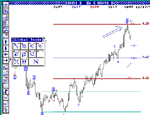
But anyway, I dustied down my copy (from the hard drive)
to give you the current automatic EW count on the weekly FTSE100.
Comes with the usual health warnings etc.
Attachments
Well, closed my up bet , after what I thought was a higher low, with a small loss.
Waited and waited, but did not like the way FTSE was not reacting to D4F SP500 quote going better.
OIl price slipping $38.41 not helping Bp -11p etc
So probably seen mid day low 😆
Waited and waited, but did not like the way FTSE was not reacting to D4F SP500 quote going better.
OIl price slipping $38.41 not helping Bp -11p etc
So probably seen mid day low 😆
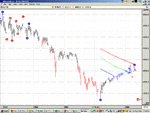
Here we go again for all you Fib watchers:
As Hooya (i think) has noted in the past,
reactions have, at times, retraced as much as 78.6% of the main move.
A recent example:
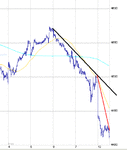
The fall from 4602 first halted at 4490.
The subsequent rally topped at at 4574 (78.4 Fib=4578)
If we are just retracing the 4602-4291 swing,
everyone noted the 62% retracement level this morning as roughly 4410.
We have spent a lot of time to-day at least paying respect to this Fib.
Clinging on to a bullish interpretation, the 78.6% retracement of this swing = 4358.
All thoughts welcome.
assuming this is normal swing and nothing more dodgy going on I would be surprised if we could get in to the 360 with out a couple of sessions bounce?? Ovesold on my 30 min chart now. Once we get down inthe 300s there is a gap at 309 that will look inviting
Last edited:
Similar threads
- Replies
- 0
- Views
- 3K
- Replies
- 0
- Views
- 2K
- Replies
- 1
- Views
- 1K


