You are using an out of date browser. It may not display this or other websites correctly.
You should upgrade or use an alternative browser.
You should upgrade or use an alternative browser.
Hooya,
You are correct if you are intra-day trading (implying you are using shorter time frame charts to trigger).
But the move may not yet be a change of trend, just a strong rally in a continuing downtrend. Doesn't preclude taking advantage of it.
However, Bracke didn't qualify his timeframe. However in an early post he refers to being a longer term position trader. "I trade the ftse and dow monthlies"
All I was trying to point out is that one has to be consistent when discussing trading. One trader's 5 minute trade could be another traders position trade etc
Therefore, it is better to clarify the intention behind the questioner. Is he a scalper/day trader/position trader. Each one will have a more sensitive attitude to a change of trend.
I become increasingly nervous of supplying answers to open ended questions unless they are properly structured. As I said yesterday, there is no one size fits all answer to most questions. The danger is that you answer to your best knowledge in one time frame, but the questioner is actually referring to a different time frame.
Last edited:
Can I thank everyone for all your posts this shortened week.
200 posts (76% of total April posts)
2723 viewings (37% of April viewings so far)
17 contributors (2 brand new)
Lets keep up the good work next week. (To encourage Bonsai to keep posting)
Thanks
Mully
200 posts (76% of total April posts)
2723 viewings (37% of April viewings so far)
17 contributors (2 brand new)
Lets keep up the good work next week. (To encourage Bonsai to keep posting)
Thanks
Mully
barjon
Legendary member
- Messages
- 10,752
- Likes
- 1,863
Well done Mully and all.
Got clobbered by a worm/virus/glitch and had to get totally cleaned out and re-built. Took an age and kept me off piste most of week.
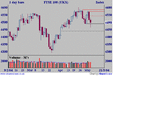
From a candlestick perspective the mid-points of the long candles (28/4 and 4/5) barely raised a tremour of resistance/support. The base of Tuesdays long up (4490) gave eod support (?) and ftse was seemingly uncomfortable below that level on Friday.
From here, key levels for me are:
4543 (mid-point of Thursday's long down) and a stall of any rise here will be short term
bearish, whilst an upward breach will be mildy bullish. Bullish strength needing upward
breach of 4571 then 4585.
4490 continued support here will be mildy bullish but a downward breach (eod) will be bearish
and may bring 4438 (mid-point of 2/4 long up) into play.
As ever, it'll do what it will.
good trading all
Attachments
Hi all
I though I'd post a few thoughts - (i) to add to the debate; (ii) to demonstrate keen interest in the thread; and (iii) to "lurn" whilst not lurking. Tangentally, "Lurker" seems a bit pejorative - "Observers" is probably a better description. Us newbies or non-pros are keen to learn. I, for one, don't mind making an idiot of myself.
1. 1 hr/1day SMA - given its proximity to the actual price, how does it help?
2. 1st day of the month - interesting posts on this - given the overall upward long-term trend of major indices, does a new month just reflect positivity? How do the markets move on a Monday - any Monday? I could contribute to the thread by looking into this - unless you tell me it's pointless.
3. RSI - what does one do when between 70 and 30? Wait?
Best regards to all.
Sharkfin
Sharkfin,
I'm in the country (dial up) so I will not reply in full until I return to London (broadband) this evening.
But here are some links to be going on with re RSI
www.investopedia.com/terms/r/rsi.asp
www.incrediblecharts.com/technical/ relative_strength_index.htm
www.stockcharts.com/education/IndicatorAnalysis/ indic_RSI.html
And to answer your question, once RSI has given its signal
you should be in your position until it gives an opposite signal.
So between 70 and 30 you should have a position.
However, their are numerous variations to the plain vanilla 70/30 settings
depending on the state of the instrument you are playing. Bull or bear.
(But that requires broadband (to stop me worrying about the profit i'm giving to BT in phone charges!!)
Shark
there is a well known adage
- Up on monday , down on tuesday ...........
if you are really interested in that sort of thing , have a look at Kaufmann's Trading Sytems and Methods
the 1hr/1day is part of my personal trading system combined with other indicators.
are you a day trader ?
yes, it does keep close to the action, but it will also stand off when required.
best used on 2min charts and as the basis for macd
Review of Week
A week of two halves.
A shortened week anyway, which began well,
with the FTSE100 drawing initial benefit from
the US equity markets own reaction to the
calming words from the FOMC
who talked about "measured" moves in interest rates.
However, markets felt as if they lacked conviction
as traders waited for the US April non-farm payroll data
on Friday to see if they confirmed the relaxed attitude towards interest rate rises.
The release of stronger than expected 288k
(highest expectation had been for 250k),
an upward revision to the strong March figure
and the first indication of manufacturing
adding to jobs (+21k) intially saw a rally.
However, this failed to follow through, and US equity markets
fell away to close at their lows on Friday.
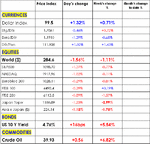
See enclosed table 1 for weekly stats:
US dollar rose (Dollar index) +0.71%
Global equities fell 1.1% with Asia Pacific (technology) falling 1.75%.
On a positive note the defensive qualities of the FTSE100 saw it rise 0.2%
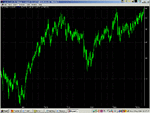
See chart 2 ( BP, Shell, Glaxo, AstraZeneca major positives)
US bonds rose 5.5% to 4.76%
Crude Oil rose 6.8%
In reality, US equity markets (and read Global markets)
have two current significant hurdles to overcome:
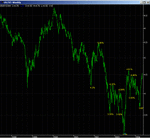
1) Rapidly rising long term interest rates. See chart 3
US 10 year bond yields have risen 100bps since March to 4.76%.
Even if Alan Greenspan has not yet raised short term rates the financial markets have!
2) Very strong Oil prices, with US Crude oil touching $40.
Attachments
Last edited:
Outlook for the FTSE100
1) I have painted a fairly cautious current global backdrop.
2) No really important FTSE 100 constituents reporting:
BskyB, BOC. Lonmin, Royal Sun Alliance, Reckitts
3)Despite the 40 point move in the FTSE 100, after the release
of the US non-farm data on Friday,
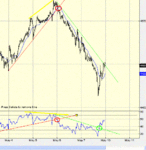
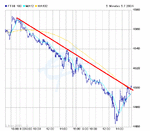
the 1 day SMA looks to have held the rally.
It is still falling, suggesting a continued negative stance towards the FTSE100.
4) Red Breakline has not been significantly breached?
5) D4F quote is at 4470/4 -indicating a 30 point fall at the open.
6) Interestingly, the FTSE250 continues to underperform
its bigger brother as cyclical stocks retreat.
This leaves the FTSE100 being propped up by a few (if significant) stocks
7) IMHO Nasdaq has to hold above its March lows (1897)
to keep the 2003/4 bull alive and kicking.
A breach of that level would be a significant test for the bulls.
But at the end of the day, the markets will do what they have to do.
These ramblings are just ramblings.
Most importantly, follow my signature comments.
Good trading and good health to you all.
Attachments
Similar threads
- Replies
- 0
- Views
- 3K
- Replies
- 0
- Views
- 2K
- Replies
- 1
- Views
- 1K

