You are using an out of date browser. It may not display this or other websites correctly.
You should upgrade or use an alternative browser.
You should upgrade or use an alternative browser.
mully
To my inexperieced eye and looking at the 3 month chart
There appears some support at 4480 but with the main support at 4380
To-day it has been down to 4463 and last I Iooked had risen to 4473.
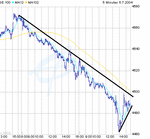
On the chart you show the trend line continues down with no upward break.
Regards
bracke
To my inexperieced eye and looking at the 3 month chart
There appears some support at 4480 but with the main support at 4380
To-day it has been down to 4463 and last I Iooked had risen to 4473.
On the chart you show the trend line continues down with no upward break.
Regards
bracke
Bracke,
Not sure what you are getting at.
I post 5min/10 min charts to focus on the current situation.
I enclose my 3 month chart.
I do not focus on picking tops and bottoms (sends you crazy in the end).
Rather I try to spot a change in trend and jump on board
not knowing how far the train is going or where sometimes!
Of course I am aware where people will be focussing on (previous support/resistance), Obvious Fib levels ('cause other use them) etc
Hopes that helps.
Attachments
This is an extract from 21Century Alerts Morning Briefing which I find strategically helpful :-
"On Thursday the Put/Call Ratio was 1.26. Since May of 2000 there have been 12 prior cases of the P/C Ratio being above 1.2. So, it happens about 3 times per year. Of those 12 cases the market has been higher 4-5 days later 10 times and lower 2 times. On average the SPX has gained 13 points in the 4-5 days subsequent to such a reading. The two losing cases lost 20 and 29 points. The 10 winning cases averaged a 17 point gain. So, taking into account both the frequency and the magnitude of the winners and losers, the advantage is about 4/1 for a long position over the next 4-5 trading days...on average."
I have been short the May 4675 Calls for a while, and this lunchtime, with prices 1.5/3.0 I placed a Limit Order to buy them back at 1.5, not expecting it to be hit at all, but happy to pay 1.5 in exchange for not waiting until expiry. Went out to walk the dog and came back to see I had been filled despite the ftse being nearly 20 points higher. It's a crazy game sometimes.
mully
I don't day trade as such, I trade the ftse and dow monthlies but may well open and close the trade on the same day or within a couple of days depending on proximity to support and resistance levels and chart trends.
I referred to the 3 month chart as it give the view I require in order to determine possible support and resistance levels
If I am honest I am probably a frustrated day trader who lacks the knowledge and experience to day trade but is confident enough to use the monthly futures to trade over 1-3 days with the safety net of several weeks if I get it wrong.
Regards
bracke
best ti call it a day probably ..if you didnt get the down swing this morning and didt get the bounce off 60 probably not going to get anything today. Have to say I dont like days like today as there is always an air of manipulation which just keeps you seconding guess.
(btw got my European times wrong Button second fastest in practice today)
(btw got my European times wrong Button second fastest in practice today)
Last edited:
failed breakthrough
Bonsai you wouldnt believe the ad i saw on the net the other day adverytising Pipers book. It's now being marketed as the ultimate trading secrets revealed/ amazing trading systems type book. Quite shockingreally that such a good book needs to use that sort of marketing
Bonsai you wouldnt believe the ad i saw on the net the other day adverytising Pipers book. It's now being marketed as the ultimate trading secrets revealed/ amazing trading systems type book. Quite shockingreally that such a good book needs to use that sort of marketing
Similar threads
- Replies
- 0
- Views
- 3K
- Replies
- 0
- Views
- 2K
- Replies
- 1
- Views
- 1K


