FTSE 100 - May

Powerful rally on Wall Street to-night.

What is of more interest is the following:

Almost five stocks advanced for every one that declined on the Big Board, with 2,802 issues rising and 571 falling. The ratio was the highest since April 5, 1994, according to Schaeffer's Investment Research in Cincinnati.
 
Steve good premium and limited risk, but you must be expecting further consolidation in a tight range with only 50 points between the strikes, and about 160 points between the break-even points with 17 trading days still left until expiry. With the Dow up 140 after the London close the FTSE is likely to open up 55 - 60 points tomorrow depending on what happens overnight. The Put/Call ratio is the highest on record which has been signaling a major rally for several days.
 
steve looks very impressive , a bit beyond my knowledge, but keep us up to date on the position
 
Another Gap!!!!
Do you fulltime traders get a bit annoyed with them ?
seems to me that after a gap the price settles into a narrow range for the rest of the day.

Iain
ps does anybody know a good book for strategies based around gaps ? - Tony Crabel book ?
 
there are a few gap trading strategies on the web that are good but most are based on spx and most mean holding for long periods etc. Gaps are annoying but lets be honest the FTSE started this move before close yesterday so it was possible to trade it if you liked with a stop at entry. The good thing with gaps are they often help the wave count as its a clear impulsive move so you know you are in aome sort of 3 or 5 imo and therefore know and slow abc move is coming before another move up.


here's a pic of a "goose" which is described in Pipers book. Very simple and very good method of trading a gap
 

Attachments

  • goose.GIF
    goose.GIF
    3.3 KB · Views: 221
Last edited:
Hooya,
Thanks for that - i suppose it was possible to keep the position open through until 9 o'clock last night to get the chunk of the move.
 
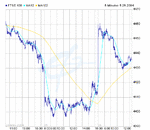
FTSE 100 Gaps over the last 10 days

I have highlighted 5 gaps in the last 10 trading days.
 

Attachments

  • chart.gif
    chart.gif
    18.4 KB · Views: 222
RogerM said:
Steve good premium and limited risk, but you must be expecting further consolidation in a tight range with only 50 points between the strikes, and about 160 points between the break-even points with 17 trading days still left until expiry. With the Dow up 140 after the London close the FTSE is likely to open up 55 - 60 points tomorrow depending on what happens overnight. The Put/Call ratio is the highest on record which has been signaling a major rally for several days.

RogerM
Yes youare right, however I had looked at the chart and offset the trade to allow for some rise in the Index. We are now bang in the midle at 4451 with break evens 80 points above and 82 below. The next bit is the tricky bit if it keeps going up past 4475 I will look at a a phased hedge covering some of the short CALL probably 250 per trade on a CFD. This strategy gives me some initial money to use and as you commented I have limited risk. I will keep everyone who's interested posted each evening with new numbers if thats useful. This is also educational for me as I normally only write PUTs on stock. By the way mixed success here.

Regards Steve
 
"have highlighted 5 gaps in the last 10 trading days." note the they have been filled aswell aoart from the 71 gap

iain..you could hold over night with a stop at cmc..
 
Got to go out for a boy's lunch.

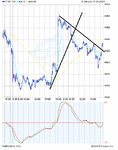
Looks like if FTSE is going to go better, it is now.

FTSE 100 has regained 1 hour SMA
and 1 Day SMA is rising underneath.

MACD appears to have ounced off zero line
 

Attachments

  • chart.gif
    chart.gif
    15.1 KB · Views: 223
ftse filled the gap but I failed to take the trade

In my defence still learning about gaps but they look interesting.

Regards

bracke
 
Back from my boy's lunch.

Not the most encouraging day at first glance, given the broadest based US equity rally in ten years.


Classic rejection of 4460 level and subsequent closing of the opening gap.

D4F offered 4467 a number of times first thing this morning, so I hope a few took the generous offer.
All depends on US to-night.
Expecting some consolidation on Wall Street after run last night.
A shallow consolidation or better should allow FTSE 100 to perform.


Once again, FTSE250 is showing better strength (which gives me encouragement).
 

Attachments

  • chart.gif
    chart.gif
    21.1 KB · Views: 196
  • chart1.gif
    chart1.gif
    37.6 KB · Views: 201
My software seems to assume that the opening price is the same as the closing, hence no gaps. I use MyBroker trading platform. I bet someone tells me to dump it and get some good stuff :)

Regards
Steve
 
"My software seems to assume that the opening price is the same as the closing, hence no gaps"

no thats they way the chart should look imo. a dot chart is exactly the same as a line chart but without teh dots joined up. Gaps are best seen in tick data. Looka t what the first tic and second tic are for the open.
 
For those without access to a dot chart ,go to yahoo finance and look at the 5 day chart.

Regards

bracke
 
I know I bang on about the FTSE250 being a better reflection of the overall UK market.
(none of those distortions from the global titans-take Vodafone's impact on Tuesday).

But I am intrigued by the stability of the FTSE250 over the last few days.

Since the lows last Monday at 5867 the FTSE250 rose 160 points to 6027.
The correction from 19/05/04 has incurred only 54 points or 34%.

So to-date the broader index is showing all the signs of inherent strength.

The index closed above the 19/05/04 high (6027) tonight at 6034.

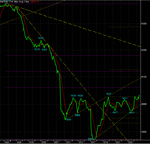
I enclose the relevant hourly chart with my "straight lines" and 1 day SMA.

The dotted magenta and brown lines are 38/50/62 retracement bands on relevant moves.

I will not comment on any EW implications.... I will leave that to all the experts.


But anyway food for thought.

Usual caveat:- All patterns on the market are meaningless- unless confirmed.
 

Attachments

  • chart.gif
    chart.gif
    17.2 KB · Views: 198
I find it interesting that its turned down off resistance at 4470 ish and now falling down the fib grid.
Fib grid 4471/4363. 236=45 .382=430.500=417.
 
Top