free real-time quotes for ftse shares

free4440273

Active member
Messages
200
Likes
2
folks, i know this has been asked of many times before, but i have something specific to ask. I need free real-time charts of ftse 100 companies (specifically the miners) but with candlesticks, not just a line chart.

ADVFN is no joy (although I do like their charts), as they kick you out after 1 min of activity (you have to pay for premium service).

digitallook is excellent: i am using it now but unfortunately it does not offer the option for candlesticks on real-time (only a line chart). Like i say, i do like it, but I need candlesticks. I would really appreciate any ideas/suggestions.

Thanks kindly folks:)
 
when i log in (successfully), and go to downloads I get the message:
An Error Has Occurred!
The topic or board you are looking for appears to be either missing or off limits to you.


any ideas CR:confused: thanks.

Ahh i see why

Try that again

(y)
 
I am using advfn free quotes (with registration) for my quotes: when i click on the ftse tab, i get a message 'not enough data has been collected'. any ideas??
 
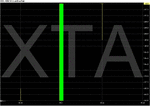
really need some help here: I want a real-time quote for xstrata (xta): I have added to my portfolio, and I get the xstrata 'tab' in the top left: when i click on the tab and chart it, the chart appears really ODD looking (see below) - any ideas how to resize into a normal looking chart???
 

Attachments

  • Chart of XTA.gif
    Chart of XTA.gif
    15.8 KB · Views: 850
really need some help here: I want a real-time quote for xstrata (xta): I have added to my portfolio, and I get the xstrata 'tab' in the top left: when i click on the tab and chart it, the chart appears really ODD looking (see below) - any ideas how to resize into a normal looking chart???

looks like you haven't got any data for that stock
which makes sense if you have just added it
you need some backfill, for that my preference is moneyAM
 
so would i need to register for moneyam; add it to QT; add the stock; and repeat etc. also, does moneyam provide candlestick charts?? I'm still not quite what the benefit of QT is then??? What I require is realtime candlestick charts of ftse stocks: digital look provides excellent real-time intraday charts (but no candlesticks). feels like i'm going round in circles. any ideas? thanks:)
 
^but live intraday charts are NOT free :confused:
I'm going round in circles here: I will repost my original post: (as below)

folks, i know this has been asked of many times before, but i have something specific to ask. I need free real-time charts of ftse 100 companies (specifically the miners) but with candlesticks, not just a line chart.

ADVFN is no joy (although I do like their charts), as they kick you out after 1 min of activity (you have to pay for premium service).

digitallook is excellent: i am using it now but unfortunately it does not offer the option for candlesticks on real-time (only a line chart). Like i say, i do like it, but I need candlesticks. I would really appreciate any ideas/suggestions.

Thanks kindly folks:)
 
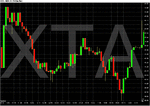
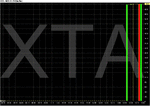
CR: thanks for your patience; i am getting there now (slowly). could i pick your brains again: i have indeed now backfilled the data using moneyam. the chart now looks far more normal, but there is still a gap on 25 june from approx 13.00 to 14.00: this is making th chart look weird. any ideas on how to rectify? thanks:)

1st chart looks normal; 2nd one does not.
 

Attachments

  • Chart of XTA.gif
    Chart of XTA.gif
    33.2 KB · Views: 623
  • Chart of XTA2.gif
    Chart of XTA2.gif
    31.3 KB · Views: 471
CR: thanks for your patience; i am getting there now (slowly). could i pick your brains again: i have indeed now backfilled the data using moneyam. the chart now looks far more normal, but there is still a gap on 25 june from approx 13.00 to 14.00: this is making th chart look weird. any ideas on how to rectify? thanks:)

1st chart looks normal; 2nd one does not.

dunno where the 2nd chart came from - looks like the same stock

what happens if you clear the chart of data and backfill again ?
 
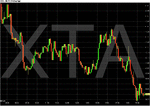
that's sorted it CR; but now it's stopped giving me a real-time quote (the chart is just static, even though it's intrady:( I just feel i'm nearly there with it...then i get another prob. any thoughts CR. thank you:)

(but that chart now does look normal at least)
 

Attachments

  • Chart of XTA3.gif
    Chart of XTA3.gif
    29.1 KB · Views: 1,944
that can happen - what do expect for a free feed

right click on the data feed - where it says ADVFN and "force re-login"
top left should be flashing green
but uk markets just closing

also you can change to moneyam feed and see the difference

.
 
Top