Update....
7 months later...
Was humbled by the market again...
But I haven't given up. I went to demo for a while, and just recently went back to live trading live and full-time.
I wanted to apologize again to any whom I might have offended with my know-it-all attitude. I won't promise any further posting of videos or trades, as I find it too distracting from my trading efforts.
What have I learned so far?
The biggest factor in trading, which I believe was pointed out to me in this thread months ago, is a good R:R. If you aren't making way more money on your winners than losers, you'll quickly blow your account.
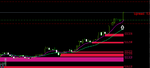
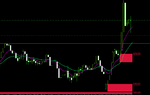
I now look for trades with at least a 5 or 10 to 1 reward/risk factor. A good example is the GBPJPY. Good entry yesterday at a 13:1 R:R.
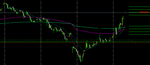
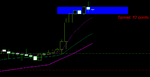
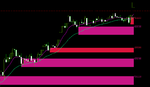
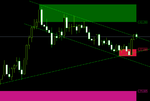
How do I find these types of trades? I look for consolidation. Ideally, at least 8 hours of consolidation. Or at least 3 or 4 hours if is a pause after a strong trend. The longer the price stays in a range, the stronger the breakout will be...
I pick my entries/targets on the H1 time frame. I also keep an eye on the H4 and D1 charts to determine overall direction. But the most important factors are 1) what is the risk? and 2) is there enough room for a good R:R? So, the next resistance level needs to be situated far enough away from your entry and SL to be a good R:R.
With this strategy it is very easy to gain 50% or more on your account with a single trade. Example: if you have $1000, and you risk $50 (5%) and you go for a 1:10 R:R then you could increase your account by 50% with 1 trade. However, I don't use percentage to determine risk, but rather a dollar amount that I find acceptable. A dollar amount that will allow me to sustain several losses, and still be able to get back into profits with a single subsequent trade using the same risk amount.
When do I enter? If I see consolidation, and a nice bounce off the bottom resistance (for long) or a nice rejection of top of consolidation (for short), I enter. But ideally, I want to trade the break out. That way the direction is confirmed, and I don't have to worry if it is going to make it out of consolidation or not. The tighter the range, the better. If the range is too wide, I may not take the trade, since the SL is at the opposite side of the consolidation after the breakout, and I don't like extremely wide SLs since it means the price has to travel that much further to obtain my desired R:R.
So, trading this way works well if you want to know right away (within a few hour most of the time), if you are right or not. You also get into profits right way most of the time. Plus, if you are wrong, usually, you can just enter in the opposite direction for a profitable trade to make up the loss and then some.
I watch 9 pairs or so, my favorites are the GBP and EUR crossed with AUD, NZD, and JPY...
I have the 8 and 21 EMA on my H1 charts. I also use an Mt4 indicator that shows me these moving averages for the Daily time frame, so I can see where the price is in relation to the daily moving averages while looking on the H1 chart.
That's all I have on my charts, so they are pretty clean. Looking at too many things confuses me, so I try to keep it simple.
And one more thing, I've determined not to hold positions over the weekend. Those gaps will kill you sooner or later if you get the direction wrong. I probably won't enter any new trades on Friday, and will close all of my trades by close on Friday.
Well, that's it in a nutshell. I wish everyone the best in your trading. Send any questions if you have any. Or feel free to shoot holes through my strategy, as I'm always willing to listen as I'm always trying to improve...
Good trading...