Best Thread Follow the Smart Money / COT Analysis

Thanks MacroStyle for the link, I’ll have a look at it.

I understand your reasoning why you look only at Large Speculators, and in general it is true, but on many occasions it is the other two participants generationg the signal, which you would not necessarly see if you only look at LS.

Have a great weekend,
Dunstan
 
Hi everyone,

Let me share with you the link to the latest Commitments of Traders review!

I would like to start with Wheat, since I was talking about it the last time already.

As the attached chart shows, nothing really changed in the picture since last week, we are still at an extreme in the COT, which – studying the past similar cases – seems to be a good short opportunity. Of course I know that some of you might want me to give exact entry levels, TP levels and stop levels, but instead I would just recommend you to have a look at other posts in the forum, where they might talk about systems, strategies that can offer a tool for such a situation. All I wish to highlight here is that Wheat is a market these days/weeks, where market participants are holding positions that are extremely long/short compared to their history. This is sort of a bubble that will burst sooner or later and it is advised to have one eye on it these days…

Live Cattle I think is also interesting. It was mentioned in the review, because Commercials changed their net position, further increased it by 16%. It is interesting really that Commercials and Large Speculators are both net long, while Small Speculators are the only ones net short in the market.

Of course as said in the review, a lot of Small Speculators are actually Commercials, they just don’t reach the so called “reporting limits”. If you look at the chart of Commercials and Small Speculators, you should see that the two lines have a strong correlation.

Looking at the picture, I would say that it is bullish, so if you were already long this market, you might want to stay in or if you were thinking of going short, this might not be the best time for that.

I am also open to discuss any particular market that you are interested in if you have any.

All the best,
Dunstan
 

Attachments

  • Report32_Wheat.png
    Report32_Wheat.png
    130.4 KB · Views: 170
  • Report32_Live Cattle.png
    Report32_Live Cattle.png
    100.3 KB · Views: 154
Dunstan:

This is only my 4th or 5th post on the forum but I have been in the markets for about 15 years or so. Nice work with the thread. It is always good to see fellow traders with a real passion for the markets. I agree with you analysis of the COT being like part of the car to make it run. Many other parts or tools are needed. The COT should be one of them. I use a few basic TA tools and some seasonal aspects of the markets. However, I don't trade contracts but write options uncovered. The timing for entries is not as critical and I sleep better at night not having to worry about my stop-loss being to close to the current price. The price can even go against me and the option premium can still go down sometimes. The COT does give some good insight to where the big money is going but other tools ARE needed before entering a trade as you stated.

Looking forward to your future posts. Pun intended :cheesy:

Trade well.
 
Hi optsonly,

I’m glad that you understand the concept I was trying to explain earlier and you use COT analysis as a part of your system. I believe that COT analysis fits well with the strategy you are using.

Do you sell closer or further options, if I may ask? (I mean the expiry) I guess we are talking about OTM options. I’ve tried this before, but I found that the liquidity in OTM options on smaller markets (oats, orange juice etc…) is very small and thus it is difficult to get in. ATM options have much larger liquidity, but selling them uncovered would be riskier I believe.

It is very exciting for me to meet someone, who uses purely an option writing strategy, cause during my studies, I found it to be possibly one of the most profitable strategies. Unfortunately in practice I haven’t used it that often and for the reasons mentioned above I put it aside… but I’m always thinking of getting back to it one day.

I think that COT analysis combined with a good option writing strategy may become a profitable system. One of the most significant signals from the COT report is those situations when there is a COT extreme in the market. The only difficulty is that such an extreme can last for weeks before prices start to react to the signal, so with a more classical trading technique, you would be using wider stops to enter the trade leading you to a poorer Risk/Reward ratio. If one was to sell an OTM option at the extreme, he would pretty far from the spot price, thus the delta would be small enough to bear the price action against him for quite some time. And time is always your friend in option writing, which is also favorable.

Would you consider opening a thread on this strategy? I would definitely be following it! :)

Thanks for your post,
Have a great day,
Dunstan
 
Dunstan:

The options I sell are OTM and are can be a good bit away from the underlying price. I am more concerned with the time decay of the premium of the option. However, I still approach selling the options as I would trading the contracts outright. The 'signal' has to be there if I were to go long or short a contract for me to sell a put or a call option. There have been many times, and I am pretty sure that I am speaking to every trader here, when we had the market direction correct but we were stopped out too soon. If I sell an option that is 30% or 40% away from the current price that gives me a lot of room to let the 'shake-out' happen and keep me in the market.

I am not too concerned with the delta because there can be less opportunities to sell options during a month or quarter versus trading contracts so if I use the delta as a filter also then that could limit my trades. For, instance there can be a lot of opportunities to reenter a trend when trading contracts but if there is a seasonal aspect to a certain commodity that 'should' come into play in a month or so there might not be enough time premium left in the options to sell to make it worth the risk. But, there could be ample room left in the trend to bank a few extra $$$.

I did post a thread a few days back asking if there were any option sellers in the house and there was one response. I will post there from time to time if there is some interest. A few years back I managed a website, forum, and posted to another forum with almost 3K posts with a FOREX method but the time involved was too great. I love the FOREX markets but it was taking up too much of my time and I was forgetting about the important things in life. Selling options gives me that time back. I love charts and the analysis and being able to take part in a world market that is unique has its draw for me as well.

I'll post back here and in the thread I mentioned previously....stay tuned...
 
Hi optsonly,

Thank you for the reply, much appreciated!

I’ve checked the other thread you mentioned, I hope that it will draw some attention, I will be following it!

All the best,
Dunstan
 
Hi everyone,

The latest Commitments of Traders review is out (here)
The first market that was mentioned, was Lumber, where there was a larger than average change in Commercials positions. The longer, five year chart shows us that neither commercials nor large speculators are at extreme levels, it is only small speculators, who seem to be extremely optimistic about the market (COT Index at 99%).

The size of the change in positions is definitely large enough and this coinciding with extreme optimism from SS is not a bad combination for confirming a bearish trade.

Sugar was the next market. I think this could be another good example we can use to understand COT analysis better. If you look at the 5 year chart, it is clearly visible that there was a shift in the short term trend a few weeks ago, we have moved away from the relative COT extreme and there is plenty of space left to reach a new COT extreme Buy signal. The example illustrates well that we should be careful how we view a COT change signal during a trend. I believe – agreeing with the COT review – that this signal should not be taken seriously and the down trend can continue.

I will be showing some other markets shortly, meanwhile if you would like to check out the recent COT report on other futures markets, you can do so at this service that I’m also using.

Let me know if you are interested in any specific market, I’ll try to analyze it for you!

All the best,
Dunstan
 

Attachments

  • Report33_Lumber_1yr.png
    Report33_Lumber_1yr.png
    80.3 KB · Views: 173
  • Report33_Lumber_5yr.png
    Report33_Lumber_5yr.png
    108.8 KB · Views: 159
  • Report33_Sugar_1yr.png
    Report33_Sugar_1yr.png
    82.1 KB · Views: 153
  • Report33_Sugar_5yr.png
    Report33_Sugar_5yr.png
    105.6 KB · Views: 172
Dunstan:

I've been watching the Sugar market for a while to sell puts on but this chart looks like it might have more downside. If the 19 area breaks then per the chart the next support level is around the 14 area, waaaay down there. Seasonally prices move up during the holiday time because the demand is there. I'd have to see more of a bottom trying to form and more of a 'signal' in the COT but I am watching. Even on the downside the premiums for the puts are are low, and I'm looking at the March contract.

Right now I'm flat. I'm still watching the grains to sell calls on but the confirmation for me isn't there yet. Oil has turned more political right now so there is another curve ball there.

Lumber, never touched it except with a hammer brother.

Watching.....
 
Hi optsonly,

Thank you for sharing your view on these markets!

I think that a good combination from the COT report for going long in Sugar would be this: Small Speculators net short, around 20-30.000 contracts, Commercials touching the O line, or even going a little bit net long. This would produce a great COT Extreme for prices to go up.

Lumber: I use Interactive Brokers, there the liquidity in Lumber options is rubbish, I don’t think that you could write options there. But maybe I’m wrong and since the last time I checked, it changed.

Grains: I understand your feeling, I have something similar as well. I have attached two charts, one on Corn and the other one on Wheat. Although Wheat has produced some serious COT extreme signals in the past couple of weeks, that’s not the case in Corn now, I mean there is still some space left in Corn to produce a significant COT extreme situation. I would not be surprised at all, if Wheat continued its rally and the COT extreme widened a bit more to the point where Corn “joined the team” :) and produced also such a signal. Maybe then, having COT extremes amongst more grain markets, would we have such a case, when there is just no more fuel left in the rally.

Since you are writing options, maybe it would be wise to just wait until the change in the trend has happened, prices have started to decline, the COT pictures have moved away from their extreme territories and you can start selling calls safely, with strikes just above the recent highs.

All the best,
Dunstan
 

Attachments

  • Report33_Corn.png
    Report33_Corn.png
    100.3 KB · Views: 182
  • Report33_Wheat.png
    Report33_Wheat.png
    130.5 KB · Views: 192
Hi optsonly,

Thank you for sharing your view on these markets!

I think that a good combination from the COT report for going long in Sugar would be this: Small Speculators net short, around 20-30.000 contracts, Commercials touching the O line, or even going a little bit net long. This would produce a great COT Extreme for prices to go up.

Lumber: I use Interactive Brokers, there the liquidity in Lumber options is rubbish, I don’t think that you could write options there. But maybe I’m wrong and since the last time I checked, it changed.

Grains: I understand your feeling, I have something similar as well. I have attached two charts, one on Corn and the other one on Wheat. Although Wheat has produced some serious COT extreme signals in the past couple of weeks, that’s not the case in Corn now, I mean there is still some space left in Corn to produce a significant COT extreme situation. I would not be surprised at all, if Wheat continued its rally and the COT extreme widened a bit more to the point where Corn “joined the team” :) and produced also such a signal. Maybe then, having COT extremes amongst more grain markets, would we have such a case, when there is just no more fuel left in the rally.

Since you are writing options, maybe it would be wise to just wait until the change in the trend has happened, prices have started to decline, the COT pictures have moved away from their extreme territories and you can start selling calls safely, with strikes just above the recent highs.

All the best,
Dunstan

(y)

Ahhh...the immortal word of success: "Since you are writing options, maybe it would be wise to just wait until the change in the trend has happened, prices have started to decline, the COT pictures have moved away from their extreme territories and you can start selling calls safely, with strikes just above the recent highs."

Even though when selling options the timing is not as critical as entering a contract, the trend still has to be there or begin to be there. No patience in the markets = no success.
 
Hi everyone,

The latest Commitments of Traders review is out (here)

Silver

It was interesting this week that all over metals, there were pretty large changes in the positions that Commercials, Large Speculators and Small Speculators are holding. These changes can be considered sell signals, but I think we should realize, that 2 month ago , there was a pretty bullish picture in the COT report for these markets, especially one in Silver (26th report - Commercials at a 563 report COT Extreme). The question here I think is to determine the difference in the strength of the two signals. In my opinion, a COT extreme picture could have a longer lasting effect, while a COT change signal has a shorter one. So following this analogy, if one took the signal in the 26th report and went long in metals, than it could be a good time to realize some profits and re-enter in a few days, when prices have dropped a little, since the COT extreme should have enough momentum left to push prices higher. Of course this decision should be in harmony with one’s trading system’s money management rules and trading strategy.

I have attached a 5-year chart on the 26th report for Silver and the most recent one as well. It is clearly visible that during this 2 month, the COT picture has moved away from those extreme levels. I guess we can start talking about a bearish picture again, once Commercials have reached 50.000 or more contracts net short and Small Speculators are holding roughly 15-20 thousand (or more) contracts net long.

Canadian Dollar

The changes in positions amongst all participants were relatively large. In my opinion the best picture would have been if these changes took the COT report to the extreme territories that the review was talking about, Commercials net short 100.000 or more contracts and Small Speculators net long 35.000 or more contracts. The extreme combined with the change signal would have been a very significant sell signal, but of course this change on its own could also be strong enough to push prices lower.

I wish all of you good luck to this week’s trading,
All the best,
Dunstan

the original COT report --> here
COT charts (free) --> here
 

Attachments

  • Report34_CAD.png
    Report34_CAD.png
    256.7 KB · Views: 206
  • Report34_Silver.png
    Report34_Silver.png
    221.2 KB · Views: 187
  • Report26_Silver.png
    Report26_Silver.png
    207 KB · Views: 198
Hi Dunstan,

This thread just caught my eye as I also use the COT report. I however use it in a very different manner to yourself. As far as I can tell, you use essentially the raw data.

I do not do this. I have been using COT data myself for a number of years, and I have developed a manner of analysis that uses the raw data, but converts it to a more usable form.

Essentially, without going into specifics, I also look for "extremes" in the data. I use a look-back period, which is purely arbitrary, but suits me and my style of trading, which is "swing." I produce a newsletter, past copies of which are archived and free to view/download, where my analysis with regard to the COT appears.

As I only use the S&P500 data, it won't obviously be much use to you, however I'll keep half an eye on this thread so that if/when you post an analysis of the S&P500 COT data/analysis, I'll provide my "interpretation" which will likely be quite different.

I make "live" calls based on the data each week, so again I differ in this aspect from your utilization of the data series. I'll keep an eye open as I said...

jog on
duc
 
Hi duc,

Thanks a lot for your post, it’s always a pleasure meeting traders, who are already use COT analysis.

I don’t really understand, what you consider raw data? I know for sure, that the data I use, is corrected and combined as the service provider clearly stated it on the webpage. In this aspect, the data shown on COTbase is not raw. It would be nice to see how you have converted the raw data, what you consider usable data.

The lookback periods can be modified at COTbase also: the change size can be compared to any range that you choose from few weeks to all time ranges. The COT Index can also be changed. What kind of look-back periods do you use?

I would be very much interested in how you use COT analysis in Indexes, since in my experience it is the least effective in this market category. I would enjoy changing my view after getting to know your technique - maybe it will prove that COT analysis CAN give you an edge in trading Indexes.

If you could provide a link to your page, where I could have a look at your newsletter in which you use COT analysis and give live calls, it would be great! I’m always interested in other perspectives of COT analysis and I’m open to new ideas.

All the best,
Dunstan
 
Hi duc,

Thanks a lot for your post, it’s always a pleasure meeting traders, who are already use COT analysis.

Likewise. While I'm sure it's not the case, I don't run into that many who do use the COT data, although, with the paranoia of traders, they may simply be keeping mum on the subject.

I don’t really understand, what you consider raw data? I know for sure, that the data I use, is corrected and combined as the service provider clearly stated it on the webpage. In this aspect, the data shown on COTbase is not raw. It would be nice to see how you have converted the raw data, what you consider usable data.

Possibly I didn't express myself that clearly. With the S&P500 data, I use the "Long Form" which has 3 columns; Long, Short, Spreading. This I call the "raw data." I ignore the Spreading data. I net out the Long/Short data, convert it to an index number based on a three year look-back, and calculate the %change.

The lookback periods can be modified at COTbase also: the change size can be compared to any range that you choose from few weeks to all time ranges. The COT Index can also be changed. What kind of look-back periods do you use?

As stated, three years.

I would be very much interested in how you use COT analysis in Indexes, since in my experience it is the least effective in this market category. I would enjoy changing my view after getting to know your technique - maybe it will prove that COT analysis CAN give you an edge in trading Indexes.

If you click on my "ducati998" you'll go to my information. There you will find a link to my blog. On the blog, there are 2 tabs, on the second, you'll find my weekly newsletter, which are archived, simply choose any/all and download it. I usually lead off with an analysis of the COT, particularly in the more recent ones.


If you could provide a link to your page, where I could have a look at your newsletter in which you use COT analysis and give live calls, it would be great! I’m always interested in other perspectives of COT analysis and I’m open to new ideas.

See above.

jog on
duc
 
Hi duc,

Thanks a lot for the explanations! I have to say that your blog is excellent(y), congratulations!

All the best,
Dunstan
 
Hi everyone,

The latest Commitments of Traders review is out (here)

Silver
Not much changed from last week, the size of change in positions C, LS and SS are holding changed a bit more than average (actually metals were on top again). After last week’s signal, prices did drop a bit, but the COT extreme buy signal that happened 2 month ago is still pushing prices higher. I can’ really add anything new to this compared to my 1 week ago post --> we need to wait for an extreme in COT to start thinking about a downward turn in prices.

Nasdaq-100
The COT extreme that can be found in this market is pretty significant. LS are at All-Time extreme levels, but also C and SS are close to their all-time levels as well. I’m not a “big fan” of COT signals in indexes, in my experience these are the weakest signals compared to other markets, but in this case it looks as if the signal could affect prices. I have tried to find similar cases on the chart to see what happened to prices back then (see attached chart) and I could find some working cases. The close resistance level is also favorable for traders seeking a short opportunity.

I wish all of you good luck to this week’s trading,
All the best,
Dunstan

the original COT report --> here
COT charts (free) --> here
 

Attachments

  • Report35_Silver.png
    Report35_Silver.png
    216.1 KB · Views: 243
  • Report35_Nasdaq-100.png
    Report35_Nasdaq-100.png
    239.1 KB · Views: 262
Hi,

I’ve just received a private message here on t2w from a fellow trader, who was asking me to write something about the relationship of cot data and currencies.

Well first of all, CFTC publishes COT reports on many currency futures, so the basic relationship is this; you can have a look at major market participant’s positions on these markets as well. Of course one might ask, “who are the Commercials here?” Actually they are companies, who do business internationally and require the usage of different currencies than the ones they are using at home, so they are exposed to currency risks.

Does COT analysis work on currencies? My answer is: YES
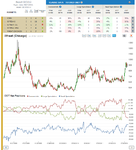
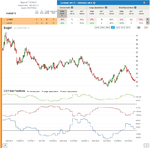
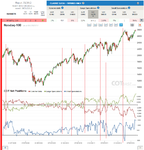
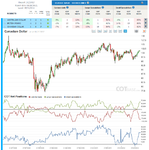
Let me show you a chart on AUD. I have indicated some places on the chart, where a turn in price direction coincides with some sort of extreme in the COT.

Of course if you would like to trade a pair, where both currencies have futures and COT reports on them, you need to analyze both of those markets’ COT report and come to conclusion, since we don’t have COT report on currency pairs.

A little analysis on currencies for you this week:

AUD
A COT Extreme Sell signal in the report --> COT Index: C - 12%, LS - 91%, SS – 65%. Prices have already started to decline, the recent top is not far if you were searching for resistance levels for your stop.
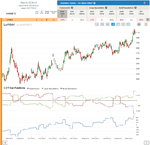
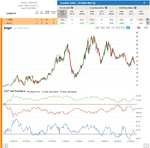
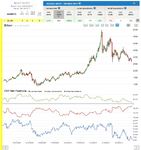
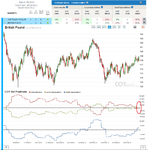
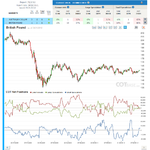
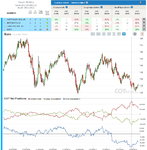
GBP
We have no COT Extreme in the market. What is interesting though is that last week only SS thought prices could go higher, C and LS both cut back on their net long positions (look at the 1 yr chart, I have indicated it).
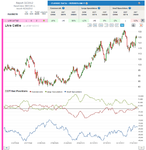
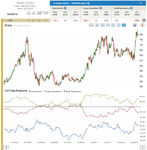
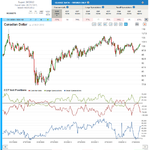
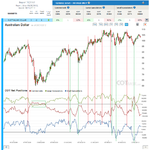
CAD
The extreme here is not as big as in AUD, but still large --> COT Index: C - 22%, LS - 84%, SS – 62%. The question is, would this extreme in the COT widen more or is this a relative top in prices. If the next COT report shows us that participants are moving away from their extreme territories, I guess that would confirm the top. One thing is for sure: base on COT analysis, the picture now is more bearish than bullish.
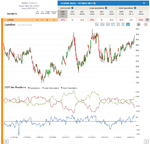
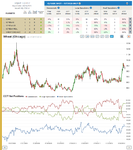
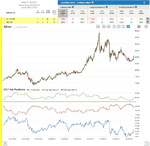
EUR
There was an All-Time COT extreme buy signal not long ago (indicated on chart), but could not push prices higher. Since then, C,LS and SS have moved away from their extremes. The fact that LS are in a buying mood (cutting back on their net short positions) is a bullish signal, on the other hand if this direction in COT would start to change and we would be witnessing another move towards extreme territories, I would be expecting prices to decline some more and I would be looking for buying opportunities, when we have reached these extreme levels, I would say, C at net long >250 000 contracts, LS < 200 000 contracts and SS <40 000 contracts.

JPY, CHF
Nothing special, we don’t really have any COT signals now.
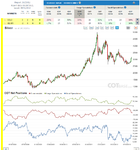
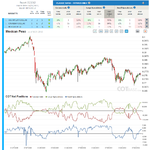
MXP
Similarly large COT extreme as in CAD --> COT Index: C - 23%, LS - 77%, SS – 67%.
The picture is bearish.

All the best,
Dunstan
 

Attachments

  • Report35_AUD.png
    Report35_AUD.png
    246.3 KB · Views: 214
  • Report35_GBP_1yr.png
    Report35_GBP_1yr.png
    203.9 KB · Views: 206
  • Report35_GBP_5yr.png
    Report35_GBP_5yr.png
    262.6 KB · Views: 214
  • Report35_CAD.png
    Report35_CAD.png
    267.4 KB · Views: 229
  • Report35_EUR.png
    Report35_EUR.png
    243.1 KB · Views: 212
Top