Best Thread Firewalker's Journey: A path of discovery in search for enlightenment

Status
Not open for further replies.
firewalker99 said:
If using MAE (and MFE?) do you mean the amount the price goes in the wrong direction after it went right?

Right, although it can turn on you in a tick.

Reversing your position sounds actually a more impulsive move? If you were sure of your trade and took it, reversing your position after all would make me doubt myself more. My plan also stipulates that I don't take a second trade after one has gone wrong in the next half hour. This helped me getting rid of some very stupid situations where I reversed, and reversed again, to have it go 3 times in a row against me... Hence the way I feel about reversal, but I guess that's personal.

It shouldn't be an impulsive move. You should have a very clear and definite protocol for it. If you don't, then you wind up doing just what you've said, reversing the reversal of a reversal.

First, if you're in the position of reversing a reversal, you're more than likely entering chop, or a state of trendlessness, and this isn't a place that you want to be unless you have chosen to do so ahead of time and have some sort of plan for trading it. Otherwise, just get away from it and go make a sandwich.

But, second, this isn't something you should be thinking about at all at this point. I mention it only because it may be an option later. You can get yourself into a real bind unless you know exactly what you're doing and what you're getting into.

Db
 
firewalker99 said:
You're right saying it wasn't pure luck. But I meant that I can give you enough examples were I did exactly the same (or I believe it to be the same) and it went in the wrong direction. I'm trying to find any confidence again but if five out of ten do as I expect, five others don't than i tend to call it luck although it isn't luck but i suppose it can't be defined as a significant statistical advantage and isn't that what an edge should give you?

Why not post some of these?

As for your earlier question regarding why there's a BO at 1300, price is rising because sellers are done, which is why trading activity (or volume) is on the low side (if sellers weren't done, but buying pressure was greater than selling pressure, price would still rise but volume would be higher). Think of holding a beach ball underwater. When you let up the pressure of your hands, the ball rises.

As for the trend being broken, not exactly, but that depends on how you define trend break and trend reversal. For me (and for a number of classicists), the trend is broken when the trendline is broken, not just tested. But there's no reversal until the last swing point has been decisively exceeded (not just tested). In this case, your trend is broken, but not reversed. Therefore, price could easily drift sideways for a while. Whether this is something you want to wait out or not is up to you. Again, this depends on what you've observed in similar situations on other charts.

Db
 
dbphoenix said:
Why not post some of these?

Db

Will do but have to adjust colors first because they are all screenshots in black/green/red.

dbphoenix said:
As for your earlier question regarding why there's a BO at 1300, price is rising because sellers are done, which is why trading activity (or volume) is on the low side (if sellers weren't done, but buying pressure was greater than selling pressure, price would still rise but volume would be higher). Think of holding a beach ball underwater. When you let up the pressure of your hands, the ball rises.


Db

Your comparison to a beach ball is strikingly similar to what I had in mind. I was thinking of a helium balloon that goes up from the moment you lift everything that was there before to put it down. it doesn't "shoot up" but moves up steadily and slowly. Anyhow, I thought this was a sign of strength, as you are saying sellers are done... but then sellers come back in and are able to push price below 5700 and back 20 points... On more than one occasion I had trouble analyzing/understanding the reasons why. So I'm with you as far as saying sellers are done, but what happens next makes no sense to me.

My plan doesn't include trading on breakouts of a trend range, so I would not act around 13:00, just wait what happens. Then I'd see it tick previous resistance at 5720. If price were to move above it, and then retrace slightly to the line, that's where I'd go long. In short, that's one part of my strategy (of course it depends on the situation and I'm always tyring to place it in a context). In this case price stays below the line however, so I stay out.

Staying out however made me miss a big up move on small volume, and around 15:00 a fast down move... This is exactly what seems to happen: I'm unable to get the "big moves" where the profit lies...
 
dbphoenix said:
Second, cutting losses short is only part of it. There are many traders out there who die the death of a thousand cuts because they maintain tight stops and cut their "losses" too short. But this issue has to be addressed in the work, not in general posts about what the average individual should or shouldn't do.

Therefore, you have at least two tasks in front of you. Achieve such a high profit:loss ratio that your win rate isn't critical to your success, or achieve a higher win rate so that your profit:loss ratio needn't be so high.

At this point you may be tempted to ask how you go about accomplishing all of that, but I don't want to short-circuit your thinking process. Mull over this for a while and we'll come back to it.

Db

I've actually had a week where I ran into losing streaks where as much as 30-40 trades all made me lose out on my account. I guess I should have quit earlier but at that time I was too emotional and couldn't believe what was happening. Now I'm aware that my stops were too tight and in hindsight I actually had a dozen good entries which could have turned out profitable.

I agree I have several tasks in front of me, but I don't want to aim at a goal to high as I've run into more than one disappointment along this path and I'm trying to build some confidence here by placing realistic goals. I've done two things to elevate the possibility for profits: my trades run much longer than before (instead of 3-5 minutes they're up to 30-50 minutes), and I've been trying to stick to "the 5 best trades of the day".

But as you say, I won't ask now how to accomplish the highest possible profit:loss ratio's as I'm probably not ready for that.
 
1 August 2006

August, the start of a new month and for me the start of what I'd like to be a stage of "enlightment" where much becomes clear. It's also the continuation of a learning phase that I'm going through. Unfortunately it has been a rough learning phase that wiped out a large aomunt of my account. I have come to terms with this however, and I'm focusing on getting a better understanding of what drives the market up/down, what puts it into a accumulation/distribution phase and so on.

I understand I've got much to learn, but I have never felt more willing to do than now. Therefore I'll continue my journal with three charts. An hour chart of the last month, one of the last week, and one of yesterday and today's opening.

This is what I see. If others could let me know their views, I'd welcome it very much.
I appreciate the effort dbphoenix already put in to respond to my charts, and hope others will follow.

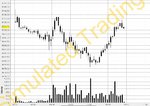
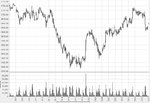
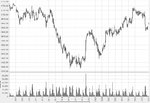
--- 20060801-a ---: I drew what I believe to be support lines.
A middle term support line at 5675 and a short term of the last week @ 5687.50 where resistance lay as you can see on 20060801-b. Perhaps I'd better call it a support zone?

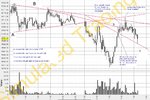
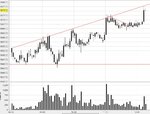
--- 20060802-b ---: The trend has been up and after an outbreak price has returned to around 5700.
-> Now this is where I'm having trouble. I'll try to be as pragmatic as I can be.
+ = reasons why I think it would go up and why I would go long @ 5687.50
- = reasons why I think it would go down (but then I would not short here)

+ price has been in this zone a lot throughout the 1st & 2nd week of June => strenghtens support
+ price has broken through the line with a high volume up bozo
+ after the airpocket it's slowly moving back but isn't successful at breaking 5700

- trend has been up for quite some time now
- buyers that have bought at lower levels (5600-5700 range) will be happy with their profits and as they see price returning they close their positions
- yesterday it already touched 5695

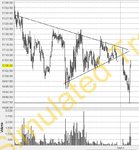
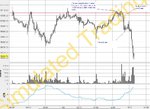
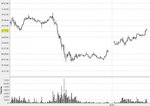
--- 20060801-c ---: yesterday's chart (coil) makes me think a outbreak on the downside is probably (and indeed that is what happens, but just for the reference I don't trade FDAX after 17:30, volume is too low and moves are mostly too erratic)

This is were I'm going in the wrong direction TWICE:

* As it spikes down to 5687.50 and moves up again, I take an entry the second time it forms a zone around 5687.50 and I go long just before 10 o' clock. Price drops to almost 5675 so I'm stopped out. I followed my plan, the weekly trend was upwards, I took a long entry. No where did I misinterpret all the data?

* Around 10:30 it touches 5687.50 again. As I'm waiting for a retest of 5675 so if I see three or more bars ranging a bit around 5687.50 I short. But as chart 20060803-d shows this is another losing trade.
 

Attachments

  • 20060801-a.JPG
    20060801-a.JPG
    211.6 KB · Views: 350
  • 20060801-b.JPG
    20060801-b.JPG
    185.1 KB · Views: 319
  • nolines.JPG
    nolines.JPG
    143.6 KB · Views: 308
  • 20060801-c.JPG
    20060801-c.JPG
    121.7 KB · Views: 347
  • 20060801-d.JPG
    20060801-d.JPG
    170.3 KB · Views: 350
difficult interpreting lines

Looking back at my mistakes, I often find that there down to drawing wrong lines...

This morning I'm having similar issues, let me give you an example.
Perhaps someone can draw his/her lines on it BEFORE looking where I draw them. The chart is a 5 min bar of yesterday's evening session and this morning up till around 12h00.

I added a chart without any lines for clarity up to 14h00.
Could really use some clues here.

Just mentioning that I'm not actually drawing all those lines on my chart. That would be quite confusing at blur the chart's visibility. But I'm wondering which of the lines would be a "correct" one?
 

Attachments

  • probnolines.JPG
    probnolines.JPG
    148.9 KB · Views: 324
  • problines.JPG
    problines.JPG
    210.6 KB · Views: 363
Last edited:
firewalker99 said:
but then sellers come back in and are able to push price below 5700 and back 20 points... On more than one occasion I had trouble analyzing/understanding the reasons why. So I'm with you as far as saying sellers are done, but what happens next makes no sense to me.

Price rises to a point where it is of interest to sellers. They then act. Just as price had fallen to a point where it was of interest to buyers. Your task -- if you want it to be your task -- is to determine at what points or levels the dynamic between buying pressure and selling pressure will change to such an extent that it will provide you with a profitable trade. If itty-bitty fluctutations are enough for you and you can figure out how to trade them profitably, that's fine. If you prefer to wait for the conditions which your testing has shown yield larger and, to you, more profitable moves, that's also fine. But you have to decide what it is you want, then determine how to go about getting it.

Staying out however made me miss a big up move on small volume, and around 15:00 a fast down move... This is exactly what seems to happen: I'm unable to get the "big moves" where the profit lies...

If your goal is to catch every move that in hindsight turned out to be profitable, then you have your work cut out for you.

If the big up move and the fast down move should have been taken if you'd followed your plan but you didn't, then that gives you one job to do. If they weren't part of your plan and you wish they had been, that's a different job. If they weren't part of your plan and you can't figure out how you could have known in advance how to play it or even if you should and you're perfectly happy with the profits you're making as it is, then to hell with it.

Part of trading is knowing when you're at your best. For some that means a couple of hours. Others can trade all day. If you become good enough at entries so that you can do size and be done in an hour or so then quit for the day, is that a bad life? Think about it.

Db
 
The framework of my trading

I've decided to add this to my journal, in case I ever need reminding myself of why I want to be a trader:

1. Why?
I want to make a living of trading, I don't want to become a millionnaire or anything of the kind, but I want it to be similar to a full time career. Instead of working for someone else or being the slave of the corporate machinery, I'm willing to choose the path less travelled.

2. How?
Daytrading is what I prefer the most. I'll be spending 8-12 hours a day looking and analyzing charts. My time frame for a trade should be about 15 to 45 minutes at most. I'm looking for about 5 trades a day, as I've experienced the less I trade the less trades are based on weak signals or impulsive reactions.

3. What?
FDAX futures starting at 8:00 till about 17:30. Around 15:30 I also start looking at ER2 till around 22:00. At lunchtimes I prefer to stay out of the market and look what happened. I'm not trading news events. I won't be trading throughout the whole day, but want to be available to the market from around 9 to 21hr. Before and after I don't follow realtime.

4. When?
The charts are 3 minutes candlestick charts, which I crossover with a 15 minute chart, and at the start of the day I take a look at the previous day and week.

5. I will not trade countertrend nor retracements itself. I will look to pick up a trend and try to place an entry before a runup or rundown phase. Within a ranging period, I'll be looking to pick up some points by buying/selling with the trend. Breakouts of S/R zones can be interesting, but I won't react on a breakout through a trendline.
 
dbphoenix said:
If your goal is to catch every move that in hindsight turned out to be profitable, then you have your work cut out for you.

If the big up move and the fast down move should have been taken if you'd followed your plan but you didn't, then that gives you one job to do. If they weren't part of your plan and you wish they had been, that's a different job. If they weren't part of your plan and you can't figure out how you could have known in advance how to play it or even if you should and you're perfectly happy with the profits you're making as it is, then to hell with it.

Part of trading is knowing when you're at your best. For some that means a couple of hours. Others can trade all day. If you become good enough at entries so that you can do size and be done in an hour or so then quit for the day, is that a bad life? Think about it.

Db

For me it's not about catching all the moves, if I'd have let's say 3 good trades per day that would be fine. If they happened during the first part of the day than I'd probably papertrade or analyze some more, read some stuff or check forums. For the moment however, I'm miles away from that target. Personally, it's not about the hours I spent on the charts, I'm willing to sit all day before my pc and watch price move around. I guess this is partly due to the fact that I want to be learning as much as possible...
 
firewalker99 said:
I agree I have several tasks in front of me, but I don't want to aim at a goal to high as I've run into more than one disappointment along this path and I'm trying to build some confidence here by placing realistic goals. I've done two things to elevate the possibility for profits: my trades run much longer than before (instead of 3-5 minutes they're up to 30-50 minutes), and I've been trying to stick to "the 5 best trades of the day".

Remember that a plan is not just a good idea or collection of good ideas that you hope will work out for the best. It's more than just "I trade hammers". Your setup has to be clearly defined, something you can recognize with no hesitation. It has to be something that you can test, i.e., something that you can find in old charts in order to determine the most probable outcomes of it, then test going forward, again using old charts, then test again going forward in real time. Letting your trades run longer may not be of much value if you're using a setup or setups that don't provide you with the high-probability outcome that you're looking for.

I'll withhold comment on the charts you've posted until the end of the day in the hope that others will chime in. But I will suggest that you have too much on your plate. Go back to the buffet and scrape off some of it, starting with volume and channels and trendlines. If S/R is your trigger, focus on that. If it isn't, then determine just what your trigger is and focus on that. But if it is, my S/R thread (below) may provide you with some help on drawing lines. If you investigate it, note that the charts were posted in real time beginning with the open. Note how the preliminary lines are drawn then modified and adjusted as traders begin to trade. In other words, don't start at the end and work your way back but rather begin at the beginning and work your way through to the end. If you have any questions about them, ask there. It's easier to keep track of what's what that way.

Db
 
firewalker99 said:
I've decided to add this to my journal, in case I ever need reminding myself of why I want to be a trader:

1. Why?
I want to make a living of trading, I don't want to become a millionnaire or anything of the kind, but I want it to be similar to a full time career. Instead of working for someone else or being the slave of the corporate machinery, I'm willing to choose the path less travelled.

2. How?
Daytrading is what I prefer the most. I'll be spending 8-12 hours a day looking and analyzing charts. My time frame for a trade should be about 15 to 45 minutes at most. I'm looking for about 5 trades a day, as I've experienced the less I trade the less trades are based on weak signals or impulsive reactions.

3. What?
FDAX futures starting at 8:00 till about 17:30. Around 15:30 I also start looking at ER2 till around 22:00. At lunchtimes I prefer to stay out of the market and look what happened. I'm not trading news events. I won't be trading throughout the whole day, but want to be available to the market from around 9 to 21hr. Before and after I don't follow realtime.

4. When?
The charts are 3 minutes candlestick charts, which I crossover with a 15 minute chart, and at the start of the day I take a look at the previous day and week.

5. I will not trade countertrend nor retracements itself. I will look to pick up a trend and try to place an entry before a runup or rundown phase. Within a ranging period, I'll be looking to pick up some points by buying/selling with the trend. Breakouts of S/R zones can be interesting, but I won't react on a breakout through a trendline.


Thank you for posting this. If I don't come back to it later, remind me.

Db
 
firewalker99 said:
For me it's not about catching all the moves, if I'd have let's say 3 good trades per day that would be fine. If they happened during the first part of the day than I'd probably papertrade or analyze some more, read some stuff or check forums. For the moment however, I'm miles away from that target. Personally, it's not about the hours I spent on the charts, I'm willing to sit all day before my pc and watch price move around. I guess this is partly due to the fact that I want to be learning as much as possible...

If you're still at the point where all of this is endlessly fascinating, then you can probably do this. But sitting in front of your screen for hours on end and watching price move is not the same as trading it. Trade only when you're at your physical and mental best. When you start to lose it, stop. Come back when you're ready. If you're not ready, then either sit on your hands and just observe or go do something else. If you have replay, you can review the action later. If you don't, you can still scroll through the chart bar by bar after the trading day is over.

Db
 
dbphoenix said:
If you're still at the point where all of this is endlessly fascinating, then you can probably do this. But sitting in front of your screen for hours on end and watching price move is not the same as trading it. Trade only when you're at your physical and mental best. When you start to lose it, stop. Come back when you're ready. If you're not ready, then either sit on your hands and just observe or go do something else. If you have replay, you can review the action later. If you don't, you can still scroll through the chart bar by bar after the trading day is over.

Db

I've used trademaven to replay some random days but FDAX is not available there.
I must also note that I'm not looking at the charts every second or minute of the day, but it is becoming a sort of addiction in a sense that I actually miss it in the weekends. If it were an addiction that I had to make a trade, that you'd probably say it's a negative one. But as I am papertrading with more eagerness to learn that ever, I hope this is a positive sign.
The more I learn, the more fascinating I find it actually - even if there have been frustrations on more than one occasion.
 
one good entry

if I had drawn that red line at the beginning of the day I would have had more than one possible setup. But I know... woulda/coulda/shoulda/... anyhow. I did take a short now and it's working out fine (still in the trade for the moment)

Before I go any further, I read your thread of plotting S/R again.
But most of your examples are quite clearly... I mean, could be me, or could me FDAX (probably the first) but I seldom seem to get that clear S/R lines. Trying to establish where support or resistance lies by checking out previous days/week and month as I've demonstrated but is there really a zone around 5707.5 ?
 

Attachments

  • 20060801-e.JPG
    20060801-e.JPG
    165.6 KB · Views: 390
firewalker99 said:
Before I go any further, I read your thread of plotting S/R again.
But most of your examples are quite clearly... I mean, could be me, or could me FDAX (probably the first) but I seldom seem to get that clear S/R lines. Trying to establish where support or resistance lies by checking out previous days/week and month as I've demonstrated but is there really a zone around 5707.5 ?

I've looked at thousands more charts than you have :) It takes time. And practice. Don't just draw your lines but study what happens when price approaches them. Does price care? Does it hesitate? Does it test? Does it just plow right through as if they weren't there?

Look for those points or levels where price is repeatedly turned back, from either side. Look also for those levels where price repeatedly fails, i.e., "weaves" through, even though there may not be a precise level where the bottoms or tops of the bars align (remember that price couldn't care less about your bars; price is in continuous flow; the "bar" is nothing more than what you've chosen to display that flow).

Db
 
dbphoenix said:
I'll withhold comment on the charts you've posted until the end of the day in the hope that others will chime in. But I will suggest that you have too much on your plate. Go back to the buffet and scrape off some of it, starting with volume and channels and trendlines. If S/R is your trigger, focus on that. If it isn't, then determine just what your trigger is and focus on that. But if it is, my S/R thread (below) may provide you with some help on drawing lines. If you investigate it, note that the charts were posted in real time beginning with the open. Note how the preliminary lines are drawn then modified and adjusted as traders begin to trade. In other words, don't start at the end and work your way back but rather begin at the beginning and work your way through to the end. If you have any questions about them, ask there. It's easier to keep track of what's what that way.

Db

I'm also hoping that others are willing to comment or observe and react on what I'm posting, but although my thread has attracted apparently a lot of views, replies some to come mainly from you. Which I'm grateful for of course! But I'd be nice if this would involve into a discussion rather than a dialogue...
 
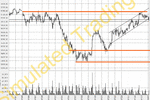
I'd like to try to offer something I hope will be constructive here, one student of price action to another. I've posted your first chart with a couple of additional S/R levels marked.

First, it occurs to me that the upper line I've drawn in has been a fairly consistent level of resistance for the duration of the chart. On the 28th, price again found resistance there and fell back over the next couple of days to 5687.50. At this point, I don't know whether price is more likely to find support at 5687.50 and move on through that resistance level or to remain in the range I've marked (and I don't follow the DAX, so I'm not sure how this actually played out), but I would be cautious at this point about going long, and would probably want to see price at least start moving back toward the top of the range before committing to a long here.

If you were to draw a line from the point where price last touched the top of the range to the last price printed, that line would roughly describe a supply line, along which sellers are offering contracts in sufficient quantity to keep price moving down. That supply line has not been broken, and until it has been, I would be in a "watching and waiting" mode. In other words, even though price is now at a level where it has found support before, I personally don't see the indication (yet) that it will bounce here again.
 

Attachments

  • fw99.gif
    fw99.gif
    291.6 KB · Views: 415
FX_Cowboy said:
If you were to draw a line from the point where price last touched the top of the range to the last price printed, that line would roughly describe a supply line, along which sellers are offering contracts in sufficient quantity to keep price moving down. That supply line has not been broken, and until it has been, I would be in a "watching and waiting" mode. In other words, even though price is now at a level where it has found support before, I personally don't see the indication (yet) that it will bounce here again.

Thanks for posting. I added a just so you can see what happened. As you indicated, price indeed droipped below and even nearly touched 5600. You say you would wait and see what happens, is that a gut feeling or based on some signals you can distinguish? Can you perhaps elaborate a bit on that?
 

Attachments

  • 20060802-a.JPG
    20060802-a.JPG
    157.8 KB · Views: 312
dbphoenix said:
Glad I asked, since this provides a good example of a high-probability short.

Note on your 30m chart of the previous week that long bozo just past the halfway point that reaches to about 5737. This provides you with an "air pocket". Price then futzes around more or less above 3725 for the remainder of the day. The fact that price opens way up there the next day is pretty much a go for a short given that there's zip support within that air pocket.

So, yes, good short.
Db

You called this a high probability short. Could you elaborate on that? What are the signals that make you say that? You name it "air pocket"... Incidentally I thought I had a similar situation today. Let me start by posting a chart of the last month, with yesterday's down move.

Ok, next is an intraday chart where I see an uptrend. Around 1100 there's a bozo on high volume. Also an "air pocket" or what is your definition of it? Not that I trade those, but anyway, the day opens with an up gap as you can see on the 2-day 5min bar chart. Next (after 1100) price drops gradually on low volume. Well, if I take everything you've said and compare it with the monthly chart, I've got 3 exact same signals. So, I guess I'd short. But as you can see, price only keeps moving up further.

Yes, no two situations are the same, everything has to be looked at in the right context.
But I'm not learning anything if for every situation there's a example pro and one contra...

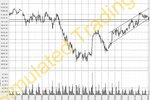
Chart 1 = monthly chart with hourly bars to include the air pocket we talked about yesterday
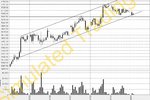
Chart 2 = intraday (today) with 3 minute bars, to get a picture of the uptrend + air pocket at 1100
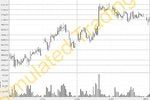
Chart 3 = yesterday + today with 5 minute bars so you can see the opening gap
 

Attachments

  • 20060802-a.JPG
    20060802-a.JPG
    157.8 KB · Views: 326
  • 20060802-b.JPG
    20060802-b.JPG
    126.8 KB · Views: 350
  • 20060802-d.JPG
    20060802-d.JPG
    100.7 KB · Views: 320
Last edited:
firewalker99 said:
Thanks for posting. I added a just so you can see what happened. As you indicated, price indeed droipped below and even nearly touched 5600. You say you would wait and see what happens, is that a gut feeling or based on some signals you can distinguish? Can you perhaps elaborate a bit on that?

I really don't have any deep insight to offer here. At the time the chart was made, price had failed to break out through resistance that had held for quite some time, and had retraced to a support area. In other words, for the last day or so, price had been falling (look at the first bar from 7/31 and compare to the last bar printed on the chart).

Given that scenario, I would not be considering a long for the sole reason that I see no indication that price will head back up again. Sure, price was at a level that had provided support in the past -- and also had been broken in the past. But price breaks through support and resistance levels all the time. All I was saying was that there was no indication (that I could find) for a long, so I would not have initiated a long at that point. I should add that I certainly did not know at that point that price would continue to fall either (perhaps a more experienced trader could have seen that coming). So, with no reason to initiate either a long or short position, I would have waited for some reason to enter a trade.
 
Status
Not open for further replies.
Top