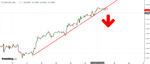
USD/CHF bulls eyeing a move back above 0.9900 handle
Regains traction on the back of renewed USD buying interest/positive US bond yields.
Fading safe-haven demand weighing on CHF and remain supportive of the up-move.
-by FX Street
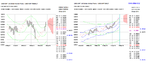
I attach the Volatility Response Model (VRM) chart described in the first post of the thread
"Predicting future FX support and resistance levels using mathematics"
Middle of short term trend channel 0.9782 is about to hit top of long term trend channel 0.9849. If the daily close falls below the short term trend channel middle then the USDCHF will fall.
USDCHF chart is updated daily on the following link
The USDCHF breaks below the 55 week EMA around the 0.9946 level, but it could find a good support around the 0.9893 level. In case of a bullish pullback, the 200 day EMA at the 1.0000 level could act as resistance.
The USDCHF breaks below the 55 week EMA around the 0.9946 level, but it could find a good support around the 0.9893 level. In case of a bullish pullback, the 200 day EMA at the 1.0000 level could act as resistance.