FIBONACCI and turning points

Fibs are one of the key tools for traders, but you need to be sure you are not looking at any form of lagging indicator which involves fibs, since you will be taking your trade one way, just as everyone is reversing, and even if it is a short reversal, you might get stopped out - most key trading involves blowing out other traders' stops
 
Wot about volume?

I do trade candles - in index futures- but I find the complete lack of commenst on volume by most writers quite astounding . (By writers I mean the pros and not us here).

Reversals in trends do not just happen. If it's an uptrend people sell out on peaks and then the price falls. If a downtrend, they cover at bottoms and then the price rises. How much it falls or rises depends on whether it's a correction or a new trend.

So I look for overbought/oversold conditions and rises in volume. As sure as night follows day those conditions combined say reversal. Indeed I have a simple scan for Volume greater than 2x the 100 bar average. If it triggers when overbought or oversold then a reversal is imminent.

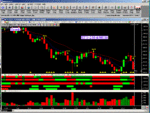
The attached chart is a 2 min chart of the S&P 500 futures for 28th June from 19:20 to close at 21:00. In this period the futures fell from 1002 to 989.5 or 12.5points. Quite a dramatic fall.. but with a couple of big rallies in between at 20.10 and 20.50.

Note the colour markers in the chart below the candle chart. The 4th and 5th - the lower 2- are ob/os indicators. When green they suggest a reversal up. When red a reversal down. The yellow upwards triangles at the foot of the candle chart show volume spikes meeting the crieria of 2x 100 average.
Note how the reversal at 20.10 is characterised by:
candle pattern/ oversold and volume spike. My EXBUY indicator. said buy (the up arrow in the chart). I did abnd caught a 2 point move from 992-994. (I was previously short). I had ignored the prior rally as the volume was too low.

Then there was an oversold indicator (red bar) at 995. and I have a sell (short) arrow - but had already closed as this was just a rally.

Finally at 20.48 reversal OB signals again and a clear double bottom - and shorters closing rally ensues. This was obvious. I bought at 990 and sold at 994. I did not short the top which would have been n even better trade as it fell from 994.5 (I missed the very top:-( to 989.5.

A combination of volume and chart patterns and indicators is very powerful.
 

Attachments

  • spoos 28june.gif
    spoos 28june.gif
    104 KB · Views: 1,119
Wot About Volume?

Wot indeed....very important in my humble opinion.

The majority of my trades are those involving holding over more than one day. Volume and bar action are very important for spotting those shake outs, climax top and bottoms, tests etc.

Mads chart should be viewed as price volume action analysis. It is surprising how quickly you get used to reading bars/volume.

Someone called Wyckoff ? wrote on the above subject in the 1930's, and his theories still have followers to this day.

Try covering up your price bars/volume bars on screen, then reveal them one at a time and see if you can spot where the price should go and the type of volume bar that causes price action in up/down moves.

Dont forget supporrt/res and consolidation levels also have a role to play.
 
Yes, agree..thanks mf for bringing up the issue and Neil for further contribution..I place great importance to volumes on chart reading, esp when expecting break up/downs on a consolidation, I'd wait for volume increase before acting, it may also help to spot false breaks..there are many other ways of making use of volumes such as comparing up/down candles volumes, keeping an eye on volumes at sup/res levels, etc...

It also helps on intraday share trading and works well with 5 min candle charts...

Riz
 
Top