jmreeve
Well-known member
- Messages
- 432
- Likes
- 13
To add to to the collection of simple profitable systems on T2W, here is a simple strategy to time the FTSE 100.
I don't trade this system as a system but use it as part of my arsenal of long term market direction indicators. However, it can be used as a profitable system in its own right.
Hope you enjoy investigating it and would be interested in any suggested improvements.
THIS THREAD IS NOT INTENDED AND SHOULD NOT BE READ AS GIVING INVESTMENT ADVICE.
FTSE Feet-up Strategy
-------------------------------------------------------
Tired of looking at a quote screen all day?
Tired of trading getting in the way of holidays?
Here is a strategy that will allow you to put your feet up but still out-perform
the FTSE100 index over the long term. The strategy uses weekly OHLC bar charts of the FTSE100 cash index and is always invested long or short. It makes a trading decision once a month giving plenty of time for rest and relaxation in between.
The rules for putting your feet up are simple:
1) Calculate the average range:
Take the range(H-L) of each of the last 20 weekly bars, add them up, divide by 20.
2) Determine if the bar is first trading week (FTW) of each month.
The first trading week is the first week of a new month containing at least 4 trading days from the new month.
3) The entries
if the close of the FTW is greater than the open
and the range of the FTW is greater than the average range
then BUY the market at the close of the week.
if the close of the FTW is less than the open
and the range of the FTW is greater than the average range
then SELL SHORT the market at the close of the week.
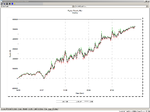
The results below are for trading the index with £100 per point over the last decade from 1994 - 2004.
This simple strategy had a near 70% accuracy of predicting the major market turns and a total
profit over 4X greater than the total losses. By timing the market once a month, the strategy
returned £500K for a 170% return on investment.
Despite a secular bull market in this period, an equivalent buy and hold investment of £300K in 1994 would now be worth £450K; a meagre 50% return on investment.
TradeStation Strategy Performance Report - FeetUp UKX.L-Weekly
Performance Summary: All Trades
Total Net Profit $512,431.81 Open position P/L $0.00
Gross Profit $674,645.63 Gross Loss ($162,213.81)
Total # of trades 23 Percent profitable 69.57%
Number winning trades16 Number losing trades 7
Largest winning trade $116,206.60 Largest losing trade ($56,533.40)
Average winning trade $42,165.35 Average losing trade ($23,173.40)
Ratio avg win/avg loss 1.82 Avg trade (win & loss) $22,279.64
Max consec. Winners 5 Max consec. losers 1
Avg # bars in winners 23 Avg # bars in losers 15
Max intraday drawdown ($101,483.41)
Profit Factor 4.16 Max # contracts held 10
Account size required $101,483.41 Return on account 504.94%
So why does it pay to put your feet up?
New money often enters the market at the beginning of the month.
When this money moves the market (range > average range)
we go with the money and enter in the same direction.
If you are a private investor and find this strategy useful/profitable,
please add me to your Christmas list.
If you are a lurking fund manager and find this strategy useful/profitable, please
a) send me a Christmas bonus or
b) hire me for a vast salary and I will tell you about some more profitable strategies.
If you are a lurking economist and think the market is efficent and can't be timed,
THINK AGAIN.
I don't trade this system as a system but use it as part of my arsenal of long term market direction indicators. However, it can be used as a profitable system in its own right.
Hope you enjoy investigating it and would be interested in any suggested improvements.
THIS THREAD IS NOT INTENDED AND SHOULD NOT BE READ AS GIVING INVESTMENT ADVICE.
FTSE Feet-up Strategy
-------------------------------------------------------
Tired of looking at a quote screen all day?
Tired of trading getting in the way of holidays?
Here is a strategy that will allow you to put your feet up but still out-perform
the FTSE100 index over the long term. The strategy uses weekly OHLC bar charts of the FTSE100 cash index and is always invested long or short. It makes a trading decision once a month giving plenty of time for rest and relaxation in between.
The rules for putting your feet up are simple:
1) Calculate the average range:
Take the range(H-L) of each of the last 20 weekly bars, add them up, divide by 20.
2) Determine if the bar is first trading week (FTW) of each month.
The first trading week is the first week of a new month containing at least 4 trading days from the new month.
3) The entries
if the close of the FTW is greater than the open
and the range of the FTW is greater than the average range
then BUY the market at the close of the week.
if the close of the FTW is less than the open
and the range of the FTW is greater than the average range
then SELL SHORT the market at the close of the week.
The results below are for trading the index with £100 per point over the last decade from 1994 - 2004.
This simple strategy had a near 70% accuracy of predicting the major market turns and a total
profit over 4X greater than the total losses. By timing the market once a month, the strategy
returned £500K for a 170% return on investment.
Despite a secular bull market in this period, an equivalent buy and hold investment of £300K in 1994 would now be worth £450K; a meagre 50% return on investment.
TradeStation Strategy Performance Report - FeetUp UKX.L-Weekly
Performance Summary: All Trades
Total Net Profit $512,431.81 Open position P/L $0.00
Gross Profit $674,645.63 Gross Loss ($162,213.81)
Total # of trades 23 Percent profitable 69.57%
Number winning trades16 Number losing trades 7
Largest winning trade $116,206.60 Largest losing trade ($56,533.40)
Average winning trade $42,165.35 Average losing trade ($23,173.40)
Ratio avg win/avg loss 1.82 Avg trade (win & loss) $22,279.64
Max consec. Winners 5 Max consec. losers 1
Avg # bars in winners 23 Avg # bars in losers 15
Max intraday drawdown ($101,483.41)
Profit Factor 4.16 Max # contracts held 10
Account size required $101,483.41 Return on account 504.94%
So why does it pay to put your feet up?
New money often enters the market at the beginning of the month.
When this money moves the market (range > average range)
we go with the money and enter in the same direction.
If you are a private investor and find this strategy useful/profitable,
please add me to your Christmas list.
If you are a lurking fund manager and find this strategy useful/profitable, please
a) send me a Christmas bonus or
b) hire me for a vast salary and I will tell you about some more profitable strategies.
If you are a lurking economist and think the market is efficent and can't be timed,
THINK AGAIN.