Mr. Charts
Legendary member
- Messages
- 7,370
- Likes
- 1,200
lloydsc said:Hi Lee
Thank you for your feedback.
This puts into context the speed at which I "should " expect to see the price move up. Thinking back to the trades they had initial momentum and then it died very quickly and this is when, as you have said, I "should" have just cut it short. If it was a proper breakout I should then have seen the T&S move quicker with more volume and then I should have been looking to the depth of the bid (ask) to decide on the bid (ask) price for my stop as it moved.
As you know it's all a matter of being aware of the component parts and putting them into practice.
Regards
Steve
timaru69 said:Hi Steve
I too find breakouts hard to read and trade well. One tactic I have incorporated is looking to see if there is a pullback to the original entry point and seeing if price is supported or rejected at this level .
Although you can miss a valid breakout it has helped when breakouts occur around whole numbers, it can also mean you are able to set a tighter stop level.
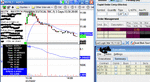
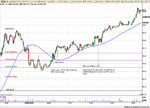
As an aside I have attached a charts for HUM which I had identified as a possible trading canidate the night before based on the daily chart. I had no particular bias as to which way I though the stock would move but just observed the price action during the morning and lunchtime sessions.
This is an example of the type of pattern I look for when trying to trade evening moves. Nice uptrend in the morning with little or no retracement over the lunch session.
In this case my entry was sound but my trade management was pretty poor (I think) as I got a bit nervous when the futures started to head down.
Cheers
Andrew
lloydsc said:Hi Andrew
For what it is worth bearing in mind I am In my early stages of development, I don't see a problem with what you are saying. I don't think you are ever going to go long at the very start of the breakout and cover at the high of the day without experience and being able to read the market sentiment in the way that Mr Charts does.
In you have an opinion that a pullback may turn into a retracement bank half and then get ready to pull the other half if it eventually does. Once you have money banked and on the table you've done your job. If you are out and and the move continues then you can get back in.
I think that if you beat your self up because you could have traded it for more return you are adding pressure that you don't need.
Regards
Steve
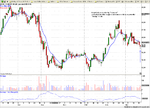
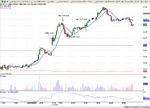
vegas said:Nice Chart example Andrew.
Have you tried placing a moving average on top of the volume bars. I find it gives a nice 'relative perspective' of interest. I use a 30 day MA.
Cheers,
Frank.
Hi Frank,vegas said:Have you tried placing a moving average on top of the volume bars. I find it gives a nice 'relative perspective' of interest. I use a 30 day MA.
One Eyed Shark said:Unlucky timaru
It is the same problem we all run with close market stops that are triggered by price hitting the stop value which will result in the platform firing off a market order to cover.
I am not aware of any way to have my trading platform trigger a stop when it is the spread that trades through the stop loss and not the price.
Sorry not very constructive
Only other option is to only trade the futs ( even less constructive )
Could I have avoided it?