Purple Brain
Experienced member
- Messages
- 1,613
- Likes
- 180
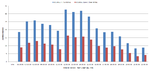
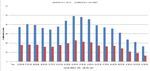
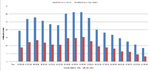
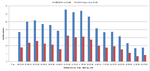
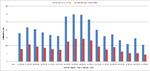
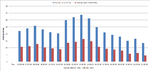
That second chart tells a real story sir. Without looking at the charts you can tell it's a spikey little devil - lots of wick compared to body aka lots of volatility and no trend.
The traders at the shortest end of the trading timeframe spectrum see things a little differently I imagine.
Does anyone who typically trades on just one timeframe ever find themselves dropping down a level or two to catch smaller absolute pip moves but with a more tradeable trend in these circumstances or do you tend to just sit it out and wait for the patterns in your chosen timeframe - or trade something else which is showing signs of life in your chosen timeframe?
LV - excellent research, it's a pleasure to see a different approach to slicing the data.