random12345
Established member
- Messages
- 793
- Likes
- 280
Excellent work. Busy bee you are!
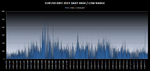
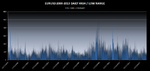
Just look at the difference in the US session between 2010 and this year. Awful. Of course, volatility is down across most markets and time frames but avg high/low near 10 pips is downright depressing.
Well done 👍
Peter
Speaking overall instead of jurisdiction specific, I think people from 09/10/11 thought the party would continue and of course it hasn't (note Volman's book for one - hope I don't get hung for that and various FF posts from those days), but then the rhythm it's settling into now is eerily reminiscent of 06/07 so it could continue for a while yet.
It does confirm at least that when it comes to forex, it's same sh!t different day and long may it reign - anything but an efficient market.
Maybe we should start our own firm and wrap up Z grade MBS into CDOs and see if we can't spark our own financial crisis and inject some volatility.