DUKAS TIMESTAMPS = START OF BAR -- GMT 00 -- LONDON
VERIFIED WITH LIVE MBT CHART COMPARISON
Dowload dataset in m15 / H1 / DAILY ask format for 1 year at a time:
http://www.dukascopy.com/swiss/english/marketwatch/historical/?ibref=2061
Open and save as excel workbook straight away as
EURUSD TF YYYY TIME OF DAY
Original downloaded file is.csv
TIMESTAMP FORMATTING
copy timestamp column to next cell
DATE FORMATTING
1st column find and replace _0* with nothing (removes time leaving date, _underscore=space)
1st column find and replace _1* with nothing (removes time leaving date, _underscore=space)
1st column find and replace _2* with nothing (removes time leaving date, _underscore=space)
***** SAVE *****
Date column left can't be date formatted
Format date column as text
Find replace . with /
***** SAVE *****
TIME FORMATTING
2nd column (copied original time & date column)
Find replace *2013 (YYYY)with nothing (removes date leaving time)
Do the same for every year (each year will be separate .csv anyway due to excel file limitations)
2nd column again, find replace .000 with nothing
***** SAVE *****
ADD DAY OF WEEK
Insert new column after date column
Select B2 and paste this formula into formula bar::
=TEXT((A2), "ddd")
Copy that cell
Paste into last cell of column
Back to B2 - select cell
CTRL+SHIFT+DOWNARROW
CTRL+D to auto fill whole column
***** SAVE *****
REMOVE SAT & SUN
Find and delete all sundays & saturdays
Home tab > conditional format > highlight cells > text containing > sun (red)
Home tab > conditional format > highlight cells > text containing > sat (red)
DATA tab > sort by day of week column - col B > sort by cell colour
My data has headers = tick box
Delete rows with red for sat / sun
***** SAVE *****
DELETE VOLUME COLUMN
===========================================
Once one sheet is complete:
Clone first completed sheet to create 2012-2004 sheets
then delete all price data leaving formulas and chart
Copy paste formatted data into clone of first sheet
select columns A-G, not entire sheet
===========================================
Once one sheet is complete the steps below can be skipped
===========================================
ADD High / Low RANGE FOR EACH OHLC DATAPOINT
Select H2 and paste this formula into formula bar:
=(E2-F2)*10000 -- gives points range for that OHLC datapoint
Copy that cell
Paste into last cell of column
Back to B2 - select cell
CTRL+SHIFT+DOWNARROW
CTRL+D to auto fill whole column
***** SAVE *****
ADD Open / Close RANGE FOR EACH OHLC DATAPOINT
Select I2 and paste this formula into formula bar:
=ABS(D2-G2)*10000 -- gives absolute points range for that OHLC datapoint
Copy that cell
Paste into last cell of column
Back to B2 - select cell
CTRL+SHIFT+DOWNARROW
CTRL+D to auto fill whole column
***** SAVE *****
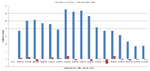
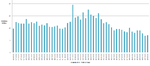
**** TIME OF DAY ANALYSIS ****
Sort by column C - time - sort by values A-Z
TIME WINDOWS
Remove times you don't need:
Delete sheet rows = midnight to 06:30 inclusive
Delete sheet rows = 20:00 to midnight inclusive
Copy column C - Time to column K
Data tab - remove duplicates in column K
***** SAVE *****
TOTAL FOR EACH TIME BRACKET
Use coumn L for total of each time bracket
Enter this formula into cell L2
Key for columns:
C = Time
H = Hi/Lo range
K = Individual time brackets - 1 cell per value
Select L2 and paste this formula into formula bar:
=SUMIF(C2:C30000,K2,H2:H30000)/COUNTIF(C2:C30000,K2)
Copy L2 cell and paste into cell below last cell in column (row 54)
Select L2 cell, then select whole column:
CTRL+SHIFT+DOWNARROW
Fill all cells in column with formula:
CTRL+D
***** SAVE *****
Create bar chart by selecting both columns K&L as dataset
===========================================
 EURUSD 2013 TIME OF DAY.PNG25.5 KB · Views: 410
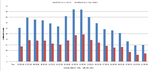 EURUSD 2011 TIME OF DAY H1.PNG27 KB · Views: 357
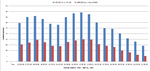 EURUSD 2010 TIME OF DAY H1.PNG26.3 KB · Views: 340
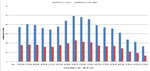 EURUSD 2009 TIME OF DAY H1.PNG24.8 KB · Views: 337
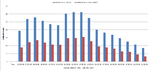 EURUSD 2012 TIME OF DAY H1.PNG25.7 KB · Views: 370
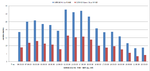 EURUSD 2013 TIME OF DAY H1.PNG26 KB · Views: 348
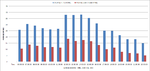 EURUSD 2004 TIME OF DAY H1.PNG25.4 KB · Views: 341
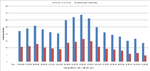 EURUSD 2005 TIME OF DAY H1.PNG24.8 KB · Views: 335
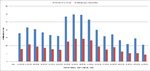 EURUSD 2006 TIME OF DAY H1.PNG24.7 KB · Views: 349
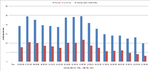 EURUSD 2007 TIME OF DAY H1.PNG25 KB · Views: 341
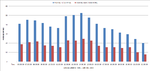 EURUSD 2008 TIME OF DAY H1.PNG25.7 KB · Views: 347