Eur/usd

Fake breakout on the EURUSD

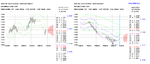
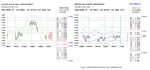
On the daily chart of the EURUSD we can see that the pair has left a long upper shadow on the daily candle above the 1.1800 level, but pulls back below that level, leaving behind a false breakout. The pair may consolidate around the 1.1800 level for now.
 
EURUSD short term bullish, long term bearish

I attach the charts for EURUSD from the Volatility Response Model

EURUSD turned short term bullish on 4 June when it closed at the end of the day above the short term trend channel middle and inside the long term trend channel.

GBPUSD followed one day later on 5 June.

The next interaction is with the the long term trend channel middle at 1.1927 .
 

Attachments

  • eurusd.PNG
    eurusd.PNG
    57.3 KB · Views: 162
Last edited:
Eurusd

The EURUSD is still consolidating between the 1.1700 level and the 1.1800 level. There is no clear direction on the pair.
 
The EURUSD is still consolidating between the 1.1700 level and the 1.1800 level. There is no clear direction on the pair.

traders will make a decision after ECB, as Fed hiking path seems to be unimportant now and comes broadly in line with expectations on US economy.
 
Consolidation on the EURUSD

The consolidation continues on the EURUSD between the 1.1600 level and the 1.1700 level. The real support is at the 1.1500 level and a breakout above the 1.1900 level could trigger a trend reversal.
 
Rally on the EURUSD

The rally on the EURUSD takes the pair to the 55 day EMA at the 1.1763 level, from where it may bounce to the downside. However, a breakout of that level could take the pair to the 200 day EMA at the 1.1900 level.
 
Good resistance on the EURUSD

The EURUSD has found a good resistance at the 55 day EMA, around the 1.1732 level. To the downside, the 1.1600 level may act as support but a breakout of the 55 day EMA could cause a correction.
 
Volatility Response Model (VRM) levels for EURUSD

I attach the EURUSD VRM predictions for this week (left chart) the next 24 hours (right chart).

I also attach the 1 hour charts with VRM levels for GBPUSD, EURGBP and EURUSD today. Weekly VRM levels in the top 1 hour charts, daily VRM levels in the bottom 1 hour charts. Times are GMT-4 . EMA channel (4,7) included.

Today's high for EURUSD was at VRM weekly S2 sentiment level 1.1740. Next stop downwards on the weekly levels for EURUSD is 1.1604
 

Attachments

  • eurusd.PNG
    eurusd.PNG
    60.4 KB · Views: 151
  • 2018-07-26-GBPUSD-EURGBP-EURUSD-1hr.png
    2018-07-26-GBPUSD-EURGBP-EURUSD-1hr.png
    547.1 KB · Views: 150
Breakdown on the EURUSD

The EURUSD breaks below the 1.1600 level and at the same time is trying to break below a symmetrical triangle identified on the daily chart. The pair may drop to the 1.1500 level.
 
Below 1.13 it will most likely reach the next bear target at 1.1115, double bottom with mid-June 2017 levels.
 
EURUSD pulls back

Nice pullback on the EURUSD, the euro corrects to the upside versus the Dollar, but the bearish trend is still in place and the pair may visit the 1.1300 level.
 
Good resistance on the EURUSD

The EURUSD has retraced exactly to the 55 day EMA around the 1.1600 level and bounces to the downside from that moving average. The 55 day EMA has been acting as a good resistance for the EURUSD lately. To the downside, the 1.1500 level may act as support, followed by the 1.1400 and 1.1300 levels. To the upside, in case of a bullish breakout of the 1.1600 zone, the price may pullback to that same level and create a breakout-pullback pattern around the 55 day EMA. Above the 1.1600 level, its next resistance could be the 1.1800 level along with the 200 day EMA.

eurusd-d1-activtrades-plc.png
 
I'll be looking to sell at 1.1790, it looks like a good opportunity with a tight stop.
 
The EURUSD has retraced exactly to the 55 day EMA around the 1.1600 level and bounces to the downside from that moving average. The 55 day EMA has been acting as a good resistance for the EURUSD lately. To the downside, the 1.1500 level may act as support, followed by the 1.1400 and 1.1300 levels. To the upside, in case of a bullish breakout of the 1.1600 zone, the price may pullback to that same level and create a breakout-pullback pattern around the 55 day EMA. Above the 1.1600 level, its next resistance could be the 1.1800 level along with the 200 day EMA.

eurusd-d1-activtrades-plc.png

Hi fxstrategist I'm new to this Forum, but I'm liking to read your posts (y) and looking forward to contribute to this thread.
 
Failed breakdown on the EURUSD

The EURUSD tries to break below the 1.1600 level, but it leaves behind a false breakout and goes back to the 1.1600 level from where it may head in any direction. The 1.1700 level may act as resistance and the 1.1500 level may act as support.
 
The EURUSD tries to break below the 1.1600 level, but it leaves behind a false breakout and goes back to the 1.1600 level from where it may head in any direction. The 1.1700 level may act as resistance and the 1.1500 level may act as support.

I fully agree with your analysis. Just opened a long position @ 1.1620 aiming to 1.1700 :rambo:.
 
Top