ETF's that track indicies?

wh92stang

Active member
Messages
229
Likes
2
I have been wondering for a while how the ETF's that track indicies maintin a comparable price for the index or commodity they follow. I'm talking mainly about the SPY (S&P 500 spider), GLD (gold), UNG (US Natural Gas Fund), and USO (US Oil fund).

With a stock, the price is formed strictly by supply/demand. With these ETF's, there is a supply/demand market, but they also must maintain a relationship with the index or commodity they are tied to. Can anyone explain this to me?

Thanks, Brad.
 
They are index tracking funds and are frequently rebalanced using various methods to track the underline. For example, the USO is a futures fund and can vary +/- 10% from the underline price. lately, it is underperforming the underline seriously.

United States Oil Fund - Daily Holdings
 
I have been wondering for a while how the ETF's that track indicies maintin a comparable price for the index or commodity they follow. I'm talking mainly about the SPY (S&P 500 spider), GLD (gold), UNG (US Natural Gas Fund), and USO (US Oil fund).

With a stock, the price is formed strictly by supply/demand. With these ETF's, there is a supply/demand market, but they also must maintain a relationship with the index or commodity they are tied to. Can anyone explain this to me?

The ETFs you mention actually hold either the underlying assets in question, or futures contracts on them. When the prices get out of line, shares of the ETF are either issued or bought back to bring things back into line.
 
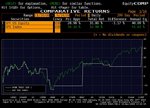
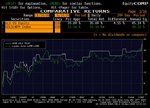
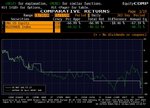
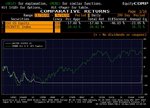
Judge for yourself:
 

Attachments

  • SPY.JPG
    SPY.JPG
    333 KB · Views: 269
  • GLD.JPG
    GLD.JPG
    334.2 KB · Views: 318
  • UNG.JPG
    UNG.JPG
    340 KB · Views: 213
  • USO.JPG
    USO.JPG
    335.5 KB · Views: 274
What is missing here are the quoted prices.
An ETF is just like a stock. It's bid/ask quotes change all the time, but the chart only changes when someone buys or sells.
If a particular ETF is not very liquid then you'll get occasional step-changes in the chart, as you can see in the above examples from Martinghoul.
Watch the quotes and see for yourself.

Glenn
True dat, to some extent, although I am not sure whether I'd describe any of the above funds as 'not very liquid'... Regardless, I think you'll agree with me, Glenn, that the well-advertised issues with the USO (that you can see in the chart easily) go beyond the bid/ask problem you have described.
 
True dat, to some extent, although I am not sure whether I'd describe any of the above funds as 'not very liquid'... Regardless, I think you'll agree with me, Glenn, that the well-advertised issues with the USO (that you can see in the chart easily) go beyond the bid/ask problem you have described.

Well I know nothing about that particular ETF, but if you compare it to the one on Yahoo
http://finance.yahoo.com/q/bc?s=USO
there appears to be something amiss.
It makes no sense to me for an ETF (which is a stock) to go below zero.

As reqards lack of liquidity, the first of your charts is a good example from March onwards. Noone bought that ETF until May !

Glenn
Ah, sorry, the charts are of the comparative returns of the two assets, not of the absolute prices...
 
Top