Elliot wave

megamuel

Experienced member
Messages
1,098
Likes
164
Ok, so I'm half way through a book ('High Probability Trading Strategies' by Robert C. Miner) and so far so good. The basic idea of the book is to teach a number of principles that can be used together for high probability trades. The book then goes on to show entry and exit techniques and examples along with money management although I have not read these sections yet.

Anyway, the principles are - Momentum, price, time, and pattern. So for the momentum aspect he basically shows you a dual time frame momentum strategy - easy, its just an indicator on 2 time frames. Price - he uses fibonacci to project possible turning points - easy. Time - again he uses fibonacci time projections from different points to give you a time range where a turning point is likely - easy. Then the part I am struggling with, Pattern. For this part he shows you a basic 5 wave Elliott Wave pattern and a ABC correction pattern. Great, also looks pretty easy. Now, I knew before looking at live charts that the patterns won't look exactly like they do in the nice examples in the book but the trouble is, upon looking at live charts, I can't seem to find these patterns! And for everyone one I find that looks sort of like an Elliott Wave, there are many others that start like one then fail.

Now, the trouble is - without being able to find these Elliott Waves and ABC corrections I can't implement the other aspects of 'Price' and 'Time' as the both use parts of the wave to make the projections! So the only part I am left with is the dual time frame momentum strategy which happens to be one of the first things I tried (unsuccesfully) in trading!

So my question to you, good folk of T2W (medbs that doesn't include you), is do Elliott Wave patterns really exist??? If so, are markets always in one phase of the pattern or are there times when markets are not erm... Elliott Waving. For those of you who subscribe to EW theory - any tips on finding them? For those of you who don't, why? I trust this thread will stay on topic and be full of reasoned and informed debate... Oh no wait, its T2W so it will probably end up with insults then pictures of women with beer or in football kits, or both! :cheesy:

Cheers guys and girl,

Sam.
 
I don't know too much about Elliot waves but I'm not a fan of it myself. From what I do know there's too much middle ground as to what constitutes a wave and what does not.

Having said that if you did want to investigate further you may want to try putting on a Zig Zag indicator and tweak it to show the waves that you are looking for. I have no idea if this can be done and if it will work, but its worth a go?
 
Last edited:
I think EW is just a different way of describing the same thing.

One guy might be sitting there looking at a 3,4,5 up/A, B, C down wave pattern and someone else would simply see a head and shoulders.

A 1,2,3 up pattern might just be seen as a double bottom by someone.

A complex wave 4 down could be viewed as a bull flag


Just different names for the same thing!

dd
 
Hello Megamuel,

You are not the first person who has encountered this difficulty. It takes time to train your eyes. If you put the time in eventually the basic structure and patterns will start to jump out at you every time you open a chart. I would suggest using the zigzag indicator as mentioned above. It helped me a lot when I was first learning. Occasionally line charts are helpful too, smoothing things out a bit. The other thing is currency pairs can get a little messy from an Elliott point of view especially on the lower time frames. I would start by viewing the big indexes that are more stable and some of the more stable individual stock issues. You will be able to pick out the patterns easier. If you find a correction or an impulse move don’t be afraid to ignore the big picture and just zoom in on the pattern. You may find a beautiful simple 5 wave impulse or abc pattern not visible until you zoom in on it. As your eyes get better you will start to notice nuances in these zoomed in patterns which can alert you to some great set ups and alert you to potential red flags keeping you out of bad trades.

I would scan the different forums for threads concerning Elliott Wave and just keep viewing as many of the posted charts as you can. The labeling will not always be correct, and you need to be aware of this, however, all you are trying to do at this point is train your eyes, not trade the patterns. I would avoid the threads with only a few people posting because if they are not correct with their labeling then you will be learning incorrectly too. I am no expert on Elliott and have no intention of becoming one, but the time is well spent on learning it. I view Elliott as an indicator and like all indicators; they have their weakness and strengths.
 
Cheers guys. I've tried using the zig zag indicator, in fact I always uses that anyway as it helps to block out some of the noise, but it didnt really help me find these patterns. D you are right about the currency pairs, its almost impossible to find this pattern on any pair but I've been looking at some stocks and a few things are standing out a bit more. I will check out the indicies. It just seems that these patterns are so infrequent, and if one does occur it never ends like the book says it is likely to! Ah well I'll stick at it!
 
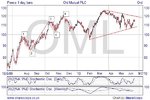
Hi.Just thought i would add my two pennys worth ,as like you i had trouble spotting wave formation untill i included stop and reverse on my charts,i can now see them clearly .
Longer term monthly and weekly charts show them up better.
hope that helps in some small way.
 

Attachments

  • ew1.gif
    ew1.gif
    37.1 KB · Views: 463
  • OML.jpg
    OML.jpg
    51.3 KB · Views: 1,308
Hi.Just thought i would add my two pennys worth ,as like you i had trouble spotting wave formation untill i included stop and reverse on my charts,i can now see them clearly .
Longer term monthly and weekly charts show them up better.
hope that helps in some small way.

Hi, What do you mean by "stop and reverse"?

Sam.
 
Sorry Sam,I was referring to Wilder's Parabolic stop and reverse.
SAR points are calculated from price and time and in so doing shows the momentum.
I only suggested it as a visual aid to help you see the waves forming and giving you all three
momentum price and time in one indicator,
Add it to your charts and you will see what i mean.
Goodluck Sam. I'm still never 100% sure what wave i'm on.(HANG FIVE)
 
A little tip for seeing the waves easier, put a 5 period sma on your chart. Will enable you to see the pull backs a little easier, and train your eye.
Kent
 
For example, are these valid 5 wave patterns???
It exists, but you should search it in different time frame, sometimes it exists in daily chart,sometimes in hourly chart, or weekly chart, counting wave is important to know wherethe market go, but different people have different counting method.

Adding a moving average is easier for identification of pull back. I agree, and I do it also.
 
Last edited:
Nifty Futures Profit for 15th April 2011.

Elliot Wave Method

As per the elliot wave method, below calls were generated.
Go Short at / below 5947.6. Stoploss at 5953.54. Target 1 is 5825.88.
Go Short at / below 5901.11. Stoploss at 5953.54. Target 2 is 5805.4.

As per the above recommendation, short triggered at 5901. Target 5825 achieved. Low made was 5820.

So profit = 5901-5825 = 76 points.

Profit of 3500+ with one lot of Nifty

http://www.pivottrading.net/pivot/pivot/elliot.html

Bollywood Photo Gallery
http://photogallery.zymichost.com/bollywood/index.php
 
I have been struggling with Elliot Wave analysis for some time and have come to the conclusion that, although it runs counter to my intuition, traders/investors do tend to act in predictable ways.

What made a believer out of me were two books, Trading Chaos (first edition) by Bill Williams and Dynamic Trading by Robert Miner. Trading Chaos gave me an introduction into his simplified version of Elliot Waves and Miner fine tuned the process for me.
In either case, if all one is looking for is a canned approach with sure fire signals to enter and exit a market, EW analysis isn't going to work.

I found that Williams' 5/34/5 MACD was an effective tool to identify promising market EW positions (or perhaps avoid disastrous ones). Pay particular attention to his bar counts. If you can get past all the psychology and the odd home-spun terms in the book, you will probably feel more comfortable with EW analysis. His subsequent books seem to be embellishments of the first book, somewhat dumbed down to simplify the subject.

Miner adds additional insights into Fib price projections and explores time projections (which Williams pretty much ignores) that gave me a lot more confidence in what Williams' MACD was showing me. One other useful insight he gave me was that if I couldn't figure out where I was in the wave pattern, I should move on. There's no prize for coming up with a labored wave count, except perhaps a dent in my trading account.

Bottom line is still that we are dealing in probabilities and I'm sure that there's more than one way to improve the odds. This is one that seems to work for me.
Happy surfing!
 
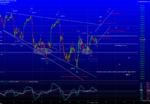
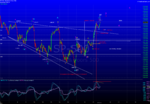
Guys i am new to T2W and stumbled across this thread... seems like alot of people dont use EW as they find it a little overwhelming! So i thought i would upload a screenshot of todays action... one chart was a forecast before the opening bell and the other was at 19:46pm!

With EW it is crucial you use other factors to bias and collate information for a predictable wave pattern... not just ASSUME where the price is going because youve seen an ABC correction then 1-5 impulse wave is next...as you will fail everytime! Instead it is important to use SUPPORT and RESISTANCE, MACD divergence and fibs from the start of wave 1 to the top of wave 3 and typically more than not, the 4th wave falls on 23.6% and 38.2%!

There are other factors but to give you an idea of what my typical chart looks like is attached:

Also note i use 10-20% news and its equally as crucial to use market sentiment and wave counts there!

REMEMBER you get WAVES within waves... from daily chart waves right the way down to MINUTES! Its useful but useless on its own! I am a big EW player and its worked for a long time for me profitable.
 

Attachments

  • SP500 - 10 Minute forecast for open.png
    SP500 - 10 Minute forecast for open.png
    228 KB · Views: 324
  • SP-500 10 Minute chart. 19.46pm.png
    SP-500 10 Minute chart. 19.46pm.png
    279.3 KB · Views: 307
Top