You are using an out of date browser. It may not display this or other websites correctly.
You should upgrade or use an alternative browser.
You should upgrade or use an alternative browser.
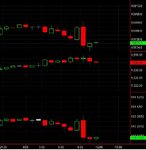
intermarket arb opportunity, equities are sluggish whereas bonds have more force. Equities catch up or bonds reverse the downward momentum, and hang at the current prices.
arb being closed up, =)....
bonds momentum died down and retracing up slightly. Equities need to bust higher for bonds to continue declines.
Attachments
I enjoyed your charts chris. Thanx for the education. 😀
no problem..
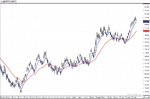
MA's want to snake higher...ultimate goal is 1552-48 area.
Attachments
I am short at 1538.75 1o cars. lokig for 4 points
price likes to test that RED MA, if the MM's hold it up here, then the RED MA, moves higher and higher as time passes.
What exactly is that red MA? :?:
its 80 low exponential MA on a 240 tic ES chart.
I just placed it on my chart. If it were to touch it, on 5 min chart it would be around 1536. Therefore, can I presume that this is the most likely placewhere ES will land evntually?
on my chart its at 37.2, based on which vendors you use and quote banks, the red ma can be variable at price points and crossing intimations. The red ma doesn't imply anything, price doesn't ever have to touch it in this current session.
Plus the MA moves as time progresses.
price likes to test that RED MA, if the MM's hold it up here, then the RED MA, moves higher and higher as time passes.
Whay is MM?
on my chart its at 37.2, based on which vendors you use and quote banks, the red ma can be variable at price points and crossing intimations. The red ma doesn't imply anything, price doesn't ever have to touch it in this current session.
Plus the MA moves as time progresses.
So what is the purpose of having it?
Whay is MM?
market makers, money managers.
So what is the purpose of having it?
its just another measure of how price is behaving, the overall direction gives gross trends in the market, it can be used as a smoothing tool. Plus when price approaches support or resistance, a shorter period MA will cross the longer period MA. The mind doesn't like to accept situations especially in trading. And indicators can be used as a another measure to justify adjusting R:R(risk:reward/stoploss:takeprofit).
on my chart its at 37.2, based on which vendors you use and quote banks, the red ma can be variable at price points and crossing intimations. The red ma doesn't imply anything, price doesn't ever have to touch it in this current session.
Plus the MA moves as time progresses.
37.2 hit. 🙂
I did not know you reside in Virgin Islands. Must be comfy and pretty.
islands are heaven on earth.
Similar threads
- Replies
- 16
- Views
- 6K