Dow Jones Update

oldschoolwaver

Junior member
Messages
16
Likes
0
Monday, July 24th 2006

Short Term Trend - Bullish 11700-11750

Long Term Trend - Bearish 9800 - 10000

Dow - Short Term Outlook

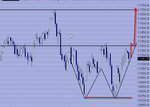
Well in Friday's update I stated that we would either go after the support line at 10800 or attack the resistance line in the 11,150 area. As you can see from today's action we chose the latter. Today we were able to close above the highs of last week's rally, which is critical for the bullish case. The next area of resistance is the high of 11,257.08. The volume was light today, which tells me that this bull run will more than likely be on light "summer volume". This lack of volume is going to be our major clue that the bear is right around the corner, hence the sub 10000 low coming in October.

For now, just sit tight and expect more follow through for the short term. Once we clear the blue resistance line below, expect the rally to get underway with earnest.

Dow_7_24_06.png


Dow - Long Term Outlook

The Dow is currently setting up a violent double bottom. Odds are we will make a minor penetration through the 10698 low (Actually occurred on Tuesday 7/18). Once we put this low in place, expect the Dow to make a new high for '06. This high will be in the 11,700 - 11,750 range. This high will be reached as early as August 14th and no later than September 1st. Once we reach this target area, the Dow will begin it's 8-year cycle low descent. This sell off will take us down to the sub 10,000 level. Expect the '04 low of 9,708.4 to be tested. This low will come on October 12th. Once this low is in place, the Dow will be ready to begin another multi-year impulsive move up that will take the Industrials to 12,000 and beyond.

Visit my site for more free analysis.
 
Wednesday, July 26th 2006

Short Term Trend - Bullish 11700-11750

Long Term Trend - Bearish 9800 - 10000


Dow - Short Term Outlook

Today was pretty wild overall. The shorts woke up today with a huge smile on their face. The news out there was just horrible. Global conflict was spinning out of control, AMZN fell off a cliff and Boeing had a crash landing. So, naturally the market opened to the downside. Then during the middle of the day, we get news from the Fed and this sparks a rally. After all this back and forth, we ended flat. Today is one of those days that the price action is small, but the message is huge. The bulls basically told the world today, throw anything our way, we can take it.

Technically today, we closed on the downtrend line from the 11,670.19 high. Tomorrow will be a huge, because the bulls have the opportunity to make a run for it. The next level of resistance is the last swing high of 11,257.08.

Dow_7_26_06.png


Dow - Long Term Outlook

The Dow is currently setting up a violent double bottom. Odds are we will make a minor penetration through the 10698 low (Actually occurred on Tuesday 7/18). Once we put this low in place, expect the Dow to make a new high for '06. This high will be in the 11,700 - 11,750 range. This high will be reached as early as August 14th and no later than September 1st. Once we reach this target area, the Dow will begin it's 8-year cycle low descent. This sell off will take us down to the sub 10,000 level. Expect the '04 low of 9,708.4 to be tested. This low will come on October 12th. Once this low is in place, the Dow will be ready to begin another multi-year impulsive move up that will take the Industrials to 12,000 and beyond. Visit my site for more free analysis.
 
Friday, July 28th 2006

Short Term Trend - Bullish 11700-11750
Long Term Trend - Bearish 9800 - 10000

Dow - Short Term Outlook

The Dow started out the day pretty strongly after the morning GDP numbers came across the tape showing the economy was slowing down. The bears had a brief moment of success, but it wasn't long before the Dow was up well over 100+ points. The Dow was up 3.2% for the week, representing the strongest percentage gain for the index since November 2004. If you recall from my earlier posts, I stated that once this rally got underway, it was going to shock everyone including myself. Well folks, I think that day has come.

Today we broke the blue trendline from the 11,670.19 top. We sat on this line for 2 days, before we finally decided that enough was enough today. Expect the Dow to attack the last swing high of 11,257.08 and expect this high to be breached. The action may get choppy in this area as many traders who took a hit in the recent sell off will be looking to get out even.

Dow_7_28_06.png


Dow - Long Term Outlook

The Dow is currently setting up a violent double bottom. Odds are we will make a minor penetration through the 10698 low (Actually occurred on Tuesday 7/18). Once we put this low in place, expect the Dow to make a new high for '06. This high will be in the 11,700 - 11,750 range. This high will be reached as early as August 14th and no later than September 1st. Once we reach this target area, the Dow will begin it's 8-year cycle low descent. This sell off will take us down to the sub 10,000 level. Expect the '04 low of 9,708.4 to be tested. This low will come on October 12th. Once this low is in place, the Dow will be ready to begin another multi-year impulsive move up that will take the Industrials to 12,000 and beyond.
 
Dont know if this question is in the right place -perhaps someone can put me right , if not.
I want to try Martin Shoebidge's strategy for daytrading the Dow, and need real time chart with commodity channel index (cci) and rsi indicators.
Would be very grateful for any help.
Rob.
 
Monday, July 31st 2006

Short Term Trend - Bullish 11700-11750

Long Term Trend - Bearish 9800 - 10000

Dow - Short Term Outlook

Today was an inside day. Meaning the Dow was unable to take out the previous day's low or high. Inside days provide the market a chance to take a breather from a strong move. Continue to look for the Dow to surpass the 11,257.08 level.

Dow_7_31_06.png


Dow - Long Term Outlook

The Dow is currently setting up a violent double bottom. Odds are we will make a minor penetration through the 10698 low (Actually occurred on Tuesday 7/18). Once we put this low in place, expect the Dow to make a new high for '06. This high will be in the 11,700 - 11,750 range. This high will be reached as early as August 14th and no later than September 1st. Once we reach this target area, the Dow will begin it's 8-year cycle low descent. This sell off will take us down to the sub 10,000 level. Expect the '04 low of 9,708.4 to be tested. This low will come on October 12th. Once this low is in place, the Dow will be ready to begin another multi-year impulsive move up that will take the Industrials to 12,000 and beyond.
 
there seems to be a resistance line if you connect the 2 june lows , is that valid
 
Im looking for the breakout over the next couple of days and maybe a run at the 11780-800 area. possibly by the end of next week.
As the undeniable Chartman would say be prepared for anything.
 

Attachments

  • chart.jpg
    chart.jpg
    101.2 KB · Views: 955
Wednesday, August 2nd 2006

Short Term Trend - Bullish 11700-11750
Long Term Trend - Bearish 9800 - 10000

Dow - Short Term Outlook

The Dow was up today from the start. We were able to maintain this up bias throughout the entire trading day. Towards the close, the bears attempted to take control, but the bulls staged a last minute bounce, which closed the Dow up 74 points on the day. I hate to assign to much importance to any one day, but the key thing I noticed is the pickup in volume to the upside from yesterday and our ability to close above yesterday's high. This gives us a clue that the bulls are in control and our next real test is the last swing high of 11,257.08.

Dow_8_02_06.png


For all you short-term trades out there, once we close above this green line, expect the market to begin accelerating to the upside.

Dow_8_02_06_v2.png
 
I'm a newbie to technical analysis and I'm constantly amazed at how support/resistance and fibonacci levels seem to hold.
Take the Dow for example. It closed almost exactly at the green resistance line in OldSchoolWavers chart above - 11242.59.
Freaky.
 
Also - I'm not convinced about this being a double bottom, because we haven't seen increased volume on the advance from the 2nd trough, and the volume on the approach to the resistance line has also been unconvincing.
I'm not sure there's enough there to see us clear, and hold above, 11243
 
rf74nz said:
Also - I'm not convinced about this being a double bottom, because we haven't seen increased volume on the advance from the 2nd trough, and the volume on the approach to the resistance line has also been unconvincing.
I'm not sure there's enough there to see us clear, and hold above, 11243

rf74nz, you are right about the volume...it will be light on this leg up in the market. This is one of our clues that this rally at some point will completely fall apart. But before we face the selling in a few weeks, the market will continue to climb this wall of worry.
 
oldschoolwaver said:
rf74nz, you are right about the volume...it will be light on this leg up in the market. This is one of our clues that this rally at some point will completely fall apart. But before we face the selling in a few weeks, the market will continue to climb this wall of worry.


I guess it depends on the jobs data out today. If it looks like your Fed's going to lift rates again to try keep inflation in check, that'll kill the rally any rally in its tracks. Conversely, if the jobs data is worse than expected, rates probably won't need to rise again so the market will rally.

IMHO - The US economy is in trouble - if interest rates go up, the housing market, which is already punch-drunk, will collapse, and with it the ability of the consumer to spend. If interest rates go down, the dollar will take a tumble and the price of all your imports'll soar, leading to yet more inflation. I can't see how either of those scenarios will play out well for the Dow.
 
millsy500 said:
among other things rf do you think paying for the war will take its toll??
I'm not familiar with the specific companies, but I'd imagine the defence sector and anything to do with supplying the defence sector will continue to do well.
However - every dollar spent on tanks, guns, bullets etc is a dollar not spent on debt reduction, education, healthcare, replacing national infrastructure, etc etc.
 
Dow Jones Industrial Average

Wednesday, August 16th 2006

Short Term Trend - Bullish 11400-11500

Long Term Trend - Bearish 9800 - 10000

Dow - Short Term Outlook

What a difference a few days can have on the market. All of the indices are in bounce mode and our short-term target is right around the corner. As we have stated in previous posts, expect the market to rally into expiration this Friday (8/18). I have been working on a new short-term trading tool that calls moves for the major indices. This indicator generally produces signals every 7 - 12 trading days. Once we receive a sell signal, I will be sure to post this information on the site.

djia_081706.png


Dow - Long Term Outlook

The Dow is currently setting up a violent double bottom. Odds are we will make a minor penetration through the 10698 low (Actually occurred on Tuesday 7/18). Once we put this low in place, expect the Dow to make a new high for '06. This high will be in the 11,700 - 11,750 range. Due to the extreme weakness in the Dow, a new high in '06 is unlikely. We will retest the last swing high of 11,344.17 before the bear returns. Once we reach this target area, the Dow will begin it's 8-year cycle low descent. This sell off will take us down to the sub 10,000 level. Expect the '04 low of 9,708.4 to be tested. This low will come on October 12th. Once this low is in place, the Dow will be ready to begin another multi-year impulsive move up that will take the Industrials to 12,000 and beyond.
 
Hi oldschoolwaver. I am a relatively newbie with Elliot waves with a few years study under my belt. I have just come across this excellent site and your excellent posts. I have joined this site using a similar name as it seemed appropriate. (Hope you don't mind.) I too believe we are about to reach a high on the Dow very soon followed by a down wave to complete a correction that has been in progress since January 2004. This will be followed by an upturn to new highs if my count is correct. I have attached my count of the Dow since the 2000 peak. I would be grateful if you reviewed it.
 

Attachments

  • a.jpg.gif
    a.jpg.gif
    18 KB · Views: 283
Last edited:
newschoolwaver said:
Hi oldschoolwaver. I am a relatively newbie with Elliot waves with a few years study under my belt. I have just come across this excellent site and your excellent posts. I have joined this site using a similar name as it seemed appropriate. (Hope you don't mind.) I too believe we are about to reach a high on the Dow very soon followed by a down wave to complete a correction that has been in progress since January 2004. This will be followed by an upturn to new highs if my count is correct. I have attached my count of the Dow since the 2000 peak. I would be grateful if you reviewed it.

Newschoolwaver - your analysis is pretty sound and you have the overall direction of the market nailed (which is the most important part of technical analysis). My only comment is your Wave A is really 1 and your (ai) is 2 and your e/(b) is really 1 of 3.

I beleive the market has put in its top and should be headed down into October to put in 2 of 3 and then we begin 3 of 3 up...which will be something dreams are made of. I closed all of my long positions today and went short. I put a pretty big trade on with the 113 october puts at 2 bucks. Let's see if it pays out.

Good Luck Trading
 
My count is looking good. The uptrend is still intact and nearing completion.
 

Attachments

  • a.GIF
    a.GIF
    21.7 KB · Views: 254
Top