Dow Intraday -Fib retacements...

ChartMan

Legendary member
Messages
5,580
Likes
47
My thanks go to Skim for her tutorship on Saturday about the DOW and Fib. Retracements. :)
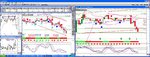
Attached is yesterday's 1 min DOW, showing the fib. retracement fro the open at 9893 to the bottom at 9812. The correlation of the various % points is awesome, and tie in very nicely with my previous obsevations about Res/Support values being around the 32/64 value.I.E the 23% was 9831, the 62% was 9862. Not in itself very exciting, BUT, as an extra tool to decide/confirm likely SR values, it is both remarkable and invaluable.
Skim showed me other very useful techniques regarding dynamic use of fibs. on the fly and I'm actively persuing those. It certainly seems a powerful ananlysis tool.
 

Attachments

  • 02_02_12.gif
    02_02_12.gif
    16.4 KB · Views: 468
yes : dynamic fibs - which I've started to use are great for seeing when retracements are likely to happen. After all the pro traders set their stops at these levels ..hence rallies and falls...
 
It's just a way to express using Fibonacci retracements on "real time" charts. The principle is this: You make the assumption that a recent fall or rise will exhibit a recovery that will "fit" Fib. retracement percentages. The smart bit is to place the start - 0% at the top or bottom and start expanding the end point, visually looking at the chart for pullbacks/support/resistance points that appear to "fit" the fib. % points. From that point,you have an extra guide as to likely pause/bounce/fail points- based on a "best fit" basis.Not a guarantee, like any TA, but a very useful guide/confidence booster.
 
Fortunately IRT which I use has the ability to set fibs so the end point will move to the high (or low if falling) of the range and stay there so it is set automatically. Funnily enough they often correspond with support and resistance (and Pivot points as well). When they do, you can virtuallyguarantee they will work.
 
Fibonacci

Hi
Where can I learn more about fibo analysis ?
 
So a dyn. fib. is the same as a fib. except it's drawn on a real time chart?

B

Yes, that's correct.CM
 
Dynamic fibs

are where the end points change as the price goes above or below the ends of the high/low s of the range you used.
My charts are set up so that the last move of the prior day is measured on a fib scale so next day all moves can initially be measured against it. Then after the first move of the day which is large I reset the fib to that and watch the moves against it.

Amazingly retracements are common at 24%, 50,38% 62% etc...


See the right hand chart for spoos retracements
 

Attachments

  • spoos.jpg
    spoos.jpg
    400.3 KB · Views: 383
Nice charts Mad... but a request from Me and Sharky- can you post them vertically next time instead of horzontally...the width goes out to the house next door :(
Thx.
 
Most peeps use the 'basic' fibonacci retracement percentages of 23%, 38%, 50%, 62%, and 100%.

What is often not used are the other points, which are 76%, 161% and 261%. Not many software programs have these three, but Sierra does and it is remarkable how often the bounces occur at 161% and 261%.

I find that the best use of the 76% is when a price does not bounce on the 62% as you would normally expect, then the 76% will. And of course, if the 76% fails then you are looking to the 100% for a double top (or bottom).

When daytrading the best thing you can do is slap fibs on everything! Every rally, tank, channel, etc, is likely to fit into one of the fib percentages. Try it, and be amazed.
 
Top