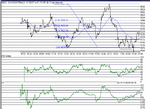
What a day. First the frightener drop to support at 9010, and then a flyer straight up to resistance at 9265. At the drop, I thought it would be all over, but there was a perfect bounce off support at 9010.The charts show Fib retracements bouncing off resistance around the 23% (9188), this then becoming support, and finally touching 38% 9273 (HOD 9280).
The positive divergence proved a winner , as did the negative divergence "rollover top" on the 1 min chart at 9260,followed by a 50 point retrace, before a final stong closing push to close 20 off the HOD at 9260.
With the initial PD , there has been a strong bull trend in force since the bottom on 30/10 @ 9079. There is no sign of a pullback and my taget from last Friday, seriously in doubt yesterday, looks to be on once again as a real possibility.From the bottom today we had a 263 point rise -almost 3%! As I see no sign of a retrace, the same again tomorrow will take us to re-test 9550. At the 50% retrace of 9333 there should ( usually) be minimal resistance, with the next point up at 9400 (62%) which may prove difficult to pass. I think a crucial point tonight was the attempted drop to the 23% retrace and fall below the 100 MA line. It dropped 20 points here,to 9212 , but strongly recovered, making only one transgression of the 100MA, before it became support again. The 100MA (ESA) line is a very important point in trading. I have seen a lot of occaisions where the DOW oscillates around the 100MA, leading to several whipsaws, before finally finding a new direction.
Final thought for today....... Is this leg 1,2 and 3 of an elliot 5 wave up.....that would be a target of 9600...250 up 50 pullback times three.

