Bill
Active member
- Messages
- 160
- Likes
- 1
Justyn
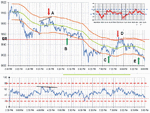
Thanks for the post and sentiment. Lets just say it does not stand scrutiny. This is just the latest in a long line of ideas.
As you say the first two trades are somewhat weak. If I were doing this for real I would probably not open two trades simultaneously anyway so there would have only been the A-C run. So I suppose D would have started the next with a close at E.
What worries me more is that it only works, in this format, on a sideways day. If there was a downward trend then it would invariably leave you on the wrong side of the market. If I could devise and indicator to show when the day is upward, downward or sideways then that would help. But I suppose then everyone would be able to win wouldn't they.
Just one further point. If you follow the dow strategy the entry point is on the cross and pullback to the 100ema line. On friday that would have cost you money [if that was all you were looking at] On a trending day that would make you money.
Please remain skeptical Justyn. I've tried a lot of different tactics and they have all ended up in the bin. Just one exception, CM's Dow strategy.
Regards
Bill
PS I do have a chart for thursday as well. Do you want that?