You are using an out of date browser. It may not display this or other websites correctly.
You should upgrade or use an alternative browser.
You should upgrade or use an alternative browser.
TraderTony
Active member
- Messages
- 180
- Likes
- 1
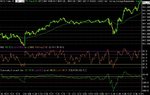
1) L 9836 at 9:50 est on first pullback to 100ema and RSI TLB. No convincing upside momentum though and soon showing a loss. Broke down below 100ema without any resistance. Got to within 1 tick of 100ema -20 stop before pulling back up through 100ema but then just zig zagged up and down. Back at entry with flat 100ema - should I just exit a situation like this? Hit new HOD but with horrible reversal bar and TLB on RSI. Straight back down to entry, sideways and then into loss.100ema held retracement and it went back up to new highs with T1 around 9875 (not reached).Again, horrible engulfing reversal bar off the new high with rapid pullback. Bounced again off 100ema and forming a tighter and tighter wedge.This time no newer high and it looks like it's breaking down. Back to 100ema right on wedge support line (and without making a higher high on last move). ES, NQ and YM all look as if they are breaking down out of wedge formations. Straight through the 100ema to the downside. Return move to 100ema then CCI/RSI TLB back up right to the wedge support line before crashing to lower lows. Arghh. Pulled right back to 100ema from below to hit resistance on RSI and CCI, however, we've had a 3x PD on last three lower lows. Ran along resistance for a while then back down before sudden spike up above 100ema but then straight back down again to new lower low then back up to 100ema. And down again. 100ema acting as strong resistance but I'm still long!! Broke above for a while but could not hold it. Eventually broke sharply to upside but could not hold and crashed back down with no clear exit. Straight back to the 100ema. What a day. Then broke back up but straight down again to 100ema. Crazy stuff. And very frustrating. No direction whatsoever and no synergy between DJ and NASDAQ. Inevitably it fell away totally at the close and left me with a 20 point loss for the day.
Part of me feels stupid for sitting with this trade in a flat, direction-less market, but against this I only had one loser - this kind of flat choppy action can do me serious damage through over-trading.
Part of me feels stupid for sitting with this trade in a flat, direction-less market, but against this I only had one loser - this kind of flat choppy action can do me serious damage through over-trading.
At least you made only one trade. There will have been,no doubt, many many that made several losing trades today, each one chasing the previous one. ......So you probably did better by several times than most..
Two day's divergence may mean one more day of down/sideways. But then what? If it is divergent, then maybe it will turn around.
Two day's divergence may mean one more day of down/sideways. But then what? If it is divergent, then maybe it will turn around.
Attachments
Tough day, as outlined by Tony. If you didn't get multiple whipsawed, then you did well. The final high in the triangle failed to make resistance and could have triggered a short... probably the best/only opportunity of the day ...... How much patience does one have to have?
Attachments
TraderTony
Active member
- Messages
- 180
- Likes
- 1
Agree CM - I should have closed on the final triangle breakout for around break even, but even so, finishing a day like today for just a small loss is real progress for me.
TraderTony said:1) ES, NQ and YM all look as if they are breaking down out of wedge formations. Straight through the 100ema to the downside. Return move to 100ema then CCI/RSI TLB back up right to the wedge support line before crashing to lower lows. Arghh.
Hi Tony....excuse my ignorance, but what does TLB and YM stand for ?....thnx, Debs
MGBRoadster
Member
- Messages
- 91
- Likes
- 0
debs said:TraderTony said:1) ES, NQ and YM all look as if they are breaking down out of wedge formations. Straight through the 100ema to the downside. Return move to 100ema then CCI/RSI TLB back up right to the wedge support line before crashing to lower lows. Arghh.
Hi Tony....excuse my ignorance, but what does TLB and YM stand for ?....thnx, Debs
Now someone else has asked I don't feel so dumb anymore 😆
ES NQ and YM are the futures indices for the S&P, NASDAQ and DOW respectively
Don't know about TLB though
Debs, CM's charts are Sierra, available thru theT2W shop on the homepage, but you then need a data feed such as Mytrack. If you progress to trading ES,YM or NQ and pay $10 or month in comission on an IB a/c then you get data feed free.
If you develop your own strat requiring more advanced charting then Qcharts or esignal( plus others no doubt) will give you Dow 1 min charts like CM's plus many other options
HTH, hampy
If you develop your own strat requiring more advanced charting then Qcharts or esignal( plus others no doubt) will give you Dow 1 min charts like CM's plus many other options
HTH, hampy
tradesmart
Experienced member
- Messages
- 1,286
- Likes
- 22
Looks like we could be building a bottom similar to the one that occurred in mid-March, and preceded a 600 point rally…..
PD in place, and now the FED appears to have given the market a boost, so maybe all it needs is for the oil price to back off a bit……?!
speculation.........speculation............
PD in place, and now the FED appears to have given the market a boost, so maybe all it needs is for the oil price to back off a bit……?!
speculation.........speculation............
Attachments
Had some success today, primarily from going short when the 19:15 news broke and then long from the flag that formed straight afterwards.
Just a couple of questions,
1. CCI dropped to about -686, I once saw CCI drop to about -900 and someone told me that when CCI is that low, the price can only go up. Is there a rule of thumb where once CCI hits a certain low you are certain (or reasonably sure) that the price will move back up?
2. I exited my long at point A on the attached chart as I saw ND and figured we had already tested resistance at around this price twice and it could be the best time to get out. I was wrong, the price carried on up to 9944. Did I do the right thing to get out and run or should I have waited?
Cheers!
Justyn.
Attachments
Debs Nice to see another young lady here ..... I must tell you that I used AIQ and TEP for a couple of years and had some great times with it, especially the EDS routines! But as time moved on, I was ( eventually) persuaded to try Sierra. Having used it now for well over two years, I can honestly say I just can't believe I put up with AIQ for so long. I guess it had it's uses for UK EOD stuff using protel data feed ( MyTrack is totally useless for UJ EOD- or at least it was). AIQ is a DOS based program that has never had the attention to bring it into the 20th Century.... hence all the "square edged/staircase" lines. I'm not surprised you can't see anything clearly. You may find it a wrench, but you should seriously consider the pain of changing. I ran both for a while until I was 100% wth Sierra, then I pulled the plug....
Justyn Any chance you can get price and time included on your charts? If you need some help, just ask....
Justyn Any chance you can get price and time included on your charts? If you need some help, just ask....
I said yesterday that we were heading for a turn, today being the third day of PD on the 10 min chart. I know, lucky guess, but usually it takes 3 days for the PD to come good. But not always. Just helps sometimes to know that, so when you are maybe undecided, you can err on the side of probability..... Like today, there were plenty looking to short..... OK on DA but on SB, you need to look a little longer term, and knowing things like this may just move you in favour of one particular direction.....
Attachments
mobile-mart
Newbie
- Messages
- 5
- Likes
- 0
Justyn...you weren't wrong..you saw a valid exit and took it for a profit....spot on in my book 😉
Remember it's a marathon not a snickers....sorry sprint 😀
Remember it's a marathon not a snickers....sorry sprint 😀
Mostly a boring day, waiting for the news at 7:15. I've mentioned this before and here is a current "news spike recovery". If you're on the wrong side of the trade - whichyouNEVER should be, don't panic as the price is likely to recover, as it did today.
To play the drop, you wait til the first bar reversal after oversold. RSI <20 or CCI <300.Or you can look at Volume on ES. The higest vol on the way down will be quite early on. Wait for a down tick that is small with much less volume, and then an up tick with large volume.You will usually see either a Doji or a Hammer as the last down tick.
Justyn,I can't tell you if youshould have waited. It has to be your choice. If you got scared, is /was your stake too high? You have to be comfortable in what you do. If you felt comfortable with your exit, then it was right. In the future, time and experience may tell you to stay in longer or get out earlier. You'll have to be patient until then and take what you consider to be the right decision. I'm always right in hindsight.Not so smart when I'm on the spot.
My T1 estimate never got off the ground because everyone was waiting for the news. T2, however,was a different matter.The 20 point pullback was a bit steep, though.
I also commented in the chat room today that on each dip, there was a distinct lack of sellers....OK . I know, there wa a lack of buyers too, but they did manage to get the price to drift up the 100MA slowly.
Attachments
Went long 9855 on the almost pd at 2-30 ish only to pull out for a near breakeven as wasn't sure if it was a pull back before another drop. Only to watch it go up for 70 odd points. 😱
Still struggling to tell whats a pull back and what isn't, in real time.
Looking back with hindsight I must have been blind to miss the inverted h&s in both cci and rsi.
Still struggling to tell whats a pull back and what isn't, in real time.
Looking back with hindsight I must have been blind to miss the inverted h&s in both cci and rsi.
Attachments
Similar threads
- Replies
- 4
- Views
- 1K