Dow Intraday Charts 9 Aug - 13 Aug

Justyn,
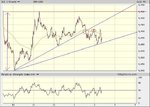
Just a quick point which may help your chart in terms of proportions. The volume data on DJIA/INDU is less than useless in my opinion as it may be a distraction. ES volume on the other hand, using CM's guidelines is a very useful tool as a back up - just re-read his stuff on this in the relevant places. YM volume is also becoming a useful aid too as the daily volume increases with time - I think this may be up as much as 50% on average since last year. Anyway it continues to rise with all of CBOT's marketing which is attracting more and more players to the instrument.
If you drop the volume off the bottom of your chart it may help to produce a clearer picture.
Just a thought!
Q
 
I agree. Drop the Dow volume. 100% pointless. Split your chart in half vertically, dow on one side, ES on the other, with vol.
 
Thanks for the suggestions regarding volume guys.

I can't figure out how to get ES in Esignal though? For the Daily Dow Cash I use $INDU - any ideas?

I'll talk to Esignal online support for help when they have woken up later today.

Justyn.
 
justyn said:
Thanks for the suggestions regarding volume guys.

I can't figure out how to get ES in Esignal though? For the Daily Dow Cash I use $INDU - any ideas?

I'll talk to Esignal online support for help when they have woken up later today.

Justyn.
Justyn
ES -- ES #2 -- This is the daily only continuous for E-mini. Note the 'space' between ..S #...
ES -- Globex -- ES #F --Globex Continuous.
Replace # with month code and F with 4 for 2004 for each Sept / Dec etc
S&P Index -- $SPX
Hope this helps.
KJH
 
ES -- ES #2 -- This is the daily only continuous for E-mini. Note the 'space' between ..S #...
ES -- Globex -- ES #F --Globex Continuous.
Replace # with month code and F with 4 for 2004 for each Sept / Dec etc
S&P Index -- $SPX

Ok so now I am confused (not difficult!)

If I want to look at ES volume as suggested by Chartman & Quercus, which of the above should I use? I'm guessing it should be ES #2 but not sure if "daily only continous for E mini" is the same thing?

Sorry to appear dim .... I'm quite a newbie. I can't see ES #2 on Esignal, probably as I haven't subscribed to it. I don't want to contact Esignal yet until I am sure what I need to see or I may end up paying for the wrong thing.

Cheers!

Justyn.
 
hampy said:
Debs, CM's charts are Sierra, available thru theT2W shop on the homepage, but you then need a data feed such as Mytrack. If you progress to trading ES,YM or NQ and pay $10 or month in comission on an IB a/c then you get data feed free.
If you develop your own strat requiring more advanced charting then Qcharts or esignal( plus others no doubt) will give you Dow 1 min charts like CM's plus many other options
HTH, hampy

Thanks Hampy - this info is very helpful...debs
 
ChartMan said:
Debs Nice to see another young lady here ..... I must tell you that I used AIQ and TEP for a couple of years and had some great times with it, especially the EDS routines! But as time moved on, I was ( eventually) persuaded to try Sierra. Having used it now for well over two years, I can honestly say I just can't believe I put up with AIQ for so long. I guess it had it's uses for UK EOD stuff using protel data feed ( MyTrack is totally useless for UJ EOD- or at least it was). AIQ is a DOS based program that has never had the attention to bring it into the 20th Century.... hence all the "square edged/staircase" lines. I'm not surprised you can't see anything clearly. You may find it a wrench, but you should seriously consider the pain of changing. I ran both for a while until I was 100% wth Sierra, then I pulled the plug....
Justyn Any chance you can get price and time included on your charts? If you need some help, just ask....

CM - thanks for the feedback on AIQ. It's good to hear from someone who has used it before. I moved to AIQ after having huge problems with Updata. But I will definitely have a look at Sierra. thanks again...debs
 
Justyn, I suspect your problem is that you haven't subscribed to the CME ( Chicago Mercantile Exchange ) for their data. An emini only fee is sufficient which is currently $15 per month if I remember correctly. Once you've been in touch with esignal and paid your dosh connection should be pretty much immediate
 
Hampy,
I'm sure you're right as I used to pay a reduced fee to the Merc through MyTrack, but of course it's free now that I've ditched MyTrack and am using IB data exclusively! :cheesy:
Q
 
1 min DJ

I feel the real triangle will break tomorrow......
 

Attachments

  • dj 11-8.JPG
    dj 11-8.JPG
    59 KB · Views: 261
Thx Q.
Didn't realise it was totally free with IB. Q charts has served it's purpose whilst I've been learning, SB ing @ £1 per point, IB a/c will be running within the next month.
No more bias :cheesy:
Still unsure whether to trade ES or YM, I hear that liquidity and fills on YM are improving all the time.
BTW if you exclusively use IB's datafeed do you use it with Sierra or something else.
Cheers, hampy
 
Hi CM

I was looking at a 1 year chart of the dow?
Is this a flag forming and do they work over long timescales?
 

Attachments

  • chart.GIF
    chart.GIF
    26.5 KB · Views: 295
I touched on that a few threads back,commenting that if it was a flag, it could be about to fail support, leading to a breakout. So well spotted.
 
I would say that we are at channel top and should move down, but I noticed something strange in after hours ES. There was a large unusual volume spike at 9:14.... I wonder why.... buying into tomorrow ?
 

Attachments

  • dow 11-08-04 10.gif
    dow 11-08-04 10.gif
    41.2 KB · Views: 277
Carlos,

as I understand it patterns work over any time frame.

do you have Murphy's book of TA?

There are some long term examples in there.

Including:

"This monthly chart of Dow Jones shows a head and shoulders bottom forming for 10 years from 1988 to 1997...... etc"

"The 1993 bottom in IBM was at the same level as the bottom formed 20 years earlier in 1974"

"Helmerich & Payne finally broke out above 19 in 1996 after failing in 1987, 1990 & 1993."

Always useful to look at the longer term picture!

Justyn.
 
Broadly uninteresting, save the RS switch + PD for a nice entry, and an ND out at the top.
 

Attachments

  • dow 11-08-04 1.gif
    dow 11-08-04 1.gif
    32.2 KB · Views: 277
CM
would you say it looks like a bear flag forming on your 10 min chart that if develops could possibly go down to the support line on Carlosd 1 year chart at about 9600

Cheers
Tony
 
Hampy,
I use the IB data feed with SierraCharts, and as long as you spend at least $10 a month in brokerage then the data is free.
There isn't any backfill however so this is a bit of a pain, in as much as you have to have the charts open during the whole of the session to get an un-interrupted chart. I've had a few problems lately while sim trading the Hang Seng, as the US server (to which I was allocated on sign up) shuts down for maintenance at 23:50 EST each day for up to an hour. This is right in the middle of the HS session, so it's a bit of a pain. Anyway I'm being transferred to the Asian server over the weekend which shuts down at 08:10 EST. I guess they've tried to use the best maintenance times depending on time zone - I only mention this in case you are trading other instruments, or want charts running 24/7!
There is an alternative to this - www.scmagic.org - which sells backdata for a modest sum I believe, but I don't have any personal experience of their service.
Don't forget that there is also an auto-logoff time with the TWS of IB - it's under "configure"/"misc" on the top menu bar.
Hope this helps. :)
Q
 
Top