Dow Intraday Charts 4 May - 7 May

ChartMan

Legendary member
Messages
5,580
Likes
47
New week.
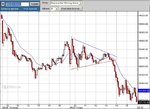
No breakout for the exp. triangle... yet... But for the high peak today, it could have been read , almost , as a bear flag with 3rd cycle failure. Still looks like winding up though, with PD still holding. Trouble with that is, that if it doesn't break to the upside, as the PD builds, it will only have one way to go. So if it's gonna go, it has to be sooner rather than later.
Not keen on these thumbnails....
 

Attachments

  • dow 04-05-04 10.gif
    dow 04-05-04 10.gif
    43.7 KB · Views: 369
You could be forgiven for taking the big ND exit at 365. Unusually, it went one more peak to 385. The really hard paart was being long at the start.... OK coming off the PD bottom, but the pullback to 270 was a bit steep to stay in... Shorting the top should have been a bit of an easier choice...
 

Attachments

  • dow 04-05-04 1.gif
    dow 04-05-04 1.gif
    29.2 KB · Views: 364
Hi CM,

Took the PD at 270 due to previous support at 264 over the last couple of days. Unfortuanetly got stopped out and got back in at pullback to 100ema and retest of 300.

I'm posting the 1 hour chart showing support/resistance points where i'm keeping an eye on for PD/ND.
 
Hi CM
There is a ND just after the start lasting about 25 min but only has two peaks. Another PD at 8.30ish lasting about eight min only two peaks again. Are these best ignored or are they tradable in your opinion.
Both would have given the desired result.
Cheers and thanks for a great thread Mel
 
Agree about the thumbnails- yer need the text with the chart- toggling between the two is a bit of a bind.

Can see why the've been introduced though- they take a lot of space up on the server.


Looks like we are going to bounce between 10,330 & 10,260.

Just broke support trend line at 10,320. So it might test that area next. ( imho)
 
This triangle is brewing, with the last low failing support whilst RSI is touching. Could mean we break tomorrow.... I make targets 400 and 460....
 

Attachments

  • dow 05-05-04 10.gif
    dow 05-05-04 10.gif
    28.8 KB · Views: 343
Melsmail, the only tradable divergences ( with good certainty) are 3 peaks across a minimum of 25 mins. Others MAY work from time to time.IF youcan get alternative confirmation, then they may well be good trades as well.
A day of divergences, but with a narrow range, little profit to be had.
 

Attachments

  • dow 05-05-04 1.gif
    dow 05-05-04 1.gif
    30.1 KB · Views: 337
The Dow Theory of Parallelism (did I make that up? ;) ) seems to be holding up for now........

But overall, I suspect that the big picture is tinged with bearishness........ :-0

ps - I like the new multiple image feature....... :cheesy:
 

Attachments

  • bear.jpg
    bear.jpg
    8.2 KB · Views: 299
  • 06-05-04.gif
    06-05-04.gif
    21.4 KB · Views: 294
But standing back a bit, things look a bit more bullish (or is this statement just an excuse to attach another picture......I'm not quite sure.........:confused:)
 

Attachments

  • 06-05-04a.gif
    06-05-04a.gif
    26.6 KB · Views: 298
  • cool bull.gif
    cool bull.gif
    8.9 KB · Views: 1,024
Very large meaningful triangle in formation.........?!
 

Attachments

  • 06-05-04b.gif
    06-05-04b.gif
    25 KB · Views: 262
What a gift! – CM’s lessons coming together to produce a gem of a trade……

A descending triangle straddling the 100ma at the end of yesterdays session leading into a tank today, but a perfect chance for a short entry on the pullback to the 100ma at 10295 ish……

PD over 35mins giving an exit signal to lock in 80 points in just over 1 hour........

I love it when a plan comes together…… ;)
 

Attachments

  • 06-05-04c.gif
    06-05-04c.gif
    18.4 KB · Views: 262
Glad it worked for you, TS..... It didn't go how I thought... Still, the clue was in the pre-market action, dropping 60, a sign of what was to come.
 

Attachments

  • dow 06-05-04 10.gif
    dow 06-05-04 10.gif
    43.5 KB · Views: 266
A case of beware the open divergence,even though it was across 34 mins, it wasn't a bottom. Yet the 22 mins PD that followed was.... Taking the short as 300 failed should have made a nice earner.
 

Attachments

  • dow 06-05-04 1.gif
    dow 06-05-04 1.gif
    27.1 KB · Views: 312
Did I miss something from the textbooks? Anyway, this channel looks like 10k, although CCI is showing at lows...
Note this is 20 min chart today.
 

Attachments

  • dow 07-05-04 10.gif
    dow 07-05-04 10.gif
    36.6 KB · Views: 287
Not an easy day, but no reason whatsoever to do anything other than look for shorts... Nice exit at RSI O/S.... even though it wasn't the lowest low..
If the price goes through a target, pulls back to it and continues the move, there is generally plenty more to come.... at least as much again. Broadly in line with EW theory, I think...
 

Attachments

  • dow 07-05-04 1.gif
    dow 07-05-04 1.gif
    24.3 KB · Views: 199
didn't trade yesterday but was following and saw a triangle on 5 and 10 min charts which delivered nicely.
 

Attachments

  • Image1.jpg
    Image1.jpg
    77.2 KB · Views: 202
Hi Chaps - unable to post a chart until 2night but that big expanding triangle on 60 min chart has been breached - target 9600 :(
 
Hi Mombassa,

Looking at the daily chart, imho we are pulling back to the 200MA ( marked with a purple dotted line)

Until we breach the 200MA & take out the March lows, we are still in an uptrend.

I see the futures have just bounced off this area, so we will have to wait & see.
 

Attachments

  • INDU_200MA.gif
    INDU_200MA.gif
    50.2 KB · Views: 207
Lockstock,

I agree...the futures are holding 10K, so might turn out to be a descending triangle.
 

Attachments

  • untitled.GIF
    untitled.GIF
    78.4 KB · Views: 187
Top