We closed last week with what looked like a down channel in the offering.( Bear Flag). Today's close suggests that it was just a pullback and we'll be off on another leg up.... Somehow my DJI chart got screwed up and I still can't get back further, even after wiping all my data. 🙁
You are using an out of date browser. It may not display this or other websites correctly.
You should upgrade or use an alternative browser.
You should upgrade or use an alternative browser.
obviously still learning at this so I may be completely wrong, but do last friday and today form a big 'W'?
http://uk.finance.yahoo.com/q?s=^DJI&d=c&k=c1&a=v&p=s&t=5d&l=on&z=l&q=l
or maybe more of an inverse H&S?
http://uk.finance.yahoo.com/q?s=^DJI&d=c&k=c1&a=v&p=s&t=5d&l=on&z=l&q=l
or maybe more of an inverse H&S?
Straight out of the blocks into an ND top across 30 mins, for a good shot at a short entry, the price just failing to break and hold Fridays SR line across 9760. Close at the failure to drop below Friday's bottom at 9700 as the price headed towards 9720. Indecision time, but a long entry at the second double bottom at 9720, with an out on the Bear Flag/ND top. Note it failed to make 64 as well..... As the price fell rapidly through the flag support, that signalled another short entry, confirmed by the bounce off the old support line at 9749. No exit at the pullback to the 100MA ( RSI V weak) , but a close at the 3rd bottom- Pos. divergence too. Long at the 100MA and RS Switch, for a nice ride to the top. Target was 9778, made right on the close. Probably well worth the wait..... Not any easy day by any means, bar the last trade.
Attachments
china white
Established member
- Messages
- 979
- Likes
- 12
Lads/lasses,
I hope u don't mind me posting my thots on ES Day trading board now - I think it's slightly more appropriate 🙂. Completely agree with CM regarding another leg up. i did not know mcClellan at the time of my posts, it is +2.52 > high probability of a pos mcclose tomorrow, latest Wednesday.
CM - u may find this interesting. I have always been reluctant to trade on magic 32 and 64 numbers - even tho day in day out I saw those numbers work..... It just felt like inviting some voodoo shaman from Malawi to help make trading decisions.... 🙂 Here we go, I heard today from a real trading fossil that there WAS a Dow strategy based on 1/3 of a figure (33 pts) before the 50ies. It was deemed that since 100 pts is such a crucial psychological step forward for the Dow, it shud be covered in 3 pushes. Still, even that logic beats me, and what about these days, when 100 pts on Dow is a puff? 🙂 I am completely baffled - but blimey it works! 🙂
Well, for what it's worth, the uncovering of 32 and 64 is down to my own curiosity and interest in the DOW. That theory ties up loosely with the fib points between 0 and 100, ie 38 and 62. As you say, if you don't understand ( or believe in it) don't trade it. Same goes for anything published by anyone!
As for posting on the ES thread it makes 100% sense.
As for posting on the ES thread it makes 100% sense.
Bill
Active member
- Messages
- 160
- Likes
- 1
China
Really enjoy your posts and yes I agree that the 'Trading the ES...' thread is appropriate. [I'm multi-tasking, I can read both!] You might want to have a word with Rossored though as the title of the summary thread is 'Trading without indicators ES summary' and you clearly use indicators. Still very minor point. Keep up the good work.
Bill 🙂
PS Chartman, the mini S&R tutorial last week helped quite a lot today, thanks.
Last edited:
china white
Established member
- Messages
- 979
- Likes
- 12
Bill, it's Stoploss's "Trading ES..." thread where I posted, not the one w/o indicators 🙂 anyway many thx for yr comment mate! 🙂
Bill
Active member
- Messages
- 160
- Likes
- 1
Ah! Ok.
If you notice CM's 'Dow intraday charts dd/mm to dd/mm" thread is summarised and posted, by Newtron Bomb, to "Trading the Dow Summary", at the end of each week.
This is clearly a success, providing a composite permanent reference record, and I think the intention is to do a similar thing with the new "Trading the ES dd/mm to dd/mm" whereby Rossored takes the weekly posts, summarises them then posts them onto "Trading without indicators (ES summary)".
Sorta wish I'd not mentioned it now as I'm sure it will sort itself out anyway. 😕
Bill
Chartman,
I see you mention that DOW broke out of its channel. When I looked last night after close (was out all day), I concluded that although it seemed an impulsive rally into the close but the market still stopped within channel (see attached chart).
Did I make mistakes in drawing of lines along the 3 tops, or are there other ways of drawing these channels. Am I missing something?
Thanks
bgold
Attachments
china white
Established member
- Messages
- 979
- Likes
- 12
just a quickie - I am tempted to c today's action as a handle on a small C&H. Also, 2nd consecutive day of pos McClellan minor change - even more temptation to expect pos mcclose on Wednesday, Thursday latest 🙂 we'll c...
Close up view of the 10 min chart showing indecision, with a big drop before the close. Not such a clear cut channel break as it looked last night. Looks like BGold has it right and CCI and RSI has lost support... back to channel? Tricky times.....
Attachments
tradesmart
Experienced member
- Messages
- 1,286
- Likes
- 22
Hi ChartMan!
Have you posted two 10 min charts for yesterday, or am I seeing double?!?
I'm inclined to concur with ChinaW's thoughts on a bullish C&H consolidation at the top of the downchannel ready to break north, despite the late slide yesterday.
Won't trade it without a tight stoploss though.....
Thanks again for the daily analysis - much appreciated!
Regards, TradeSmart
tradesmart
Experienced member
- Messages
- 1,286
- Likes
- 22
So much for the C&H theory - the handles just fallen off!!
Just giving the meths a try........LOL! 😆
Regards
Just giving the meths a try........LOL! 😆
Regards
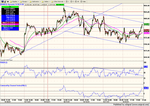
A simple day just sitting short. If you thought the second Bear Flag was a bottom, check RSI and the fact that the third peak never got anywhere near the resistance line... Triple bottom at 9580 only gave the short cover, RSI continuing to stay weak on every bull attempt.
Attachments
CM
I'm either thick or missing something, but these days when there is a large move at the open I find very difficult. What often seems to happen is once the move has finished the market tends to trade sideways, or slowly continue up or down over the rest of the day with an occasional reverse towards the end of the day. The problem therefore is do you jump in and join the original move with the possibility that you have missed the majority of the move or wait for the reversal?
Yesterday as the bear flags were unfurling I was thinking is this the beginning of a bounce? Your comment that the RSI was weak was the clue that this was not a bottom. From 14.40 to 15.20 the dow rose about 30 points and the RSI about 50 points. To me that means that the RSI move was stronger than the dow, but I must have got this totally wrong! The RSI is still a bit of a closed book to me. I have been through your Trading the Dow but the seem to have a mental block about the strength of the RSI. Could you clarify if possible?
The basic question is what was the entry signal once the open move had happened orwhat other signal should we look for?
Many thanks