You are using an out of date browser. It may not display this or other websites correctly.
You should upgrade or use an alternative browser.
You should upgrade or use an alternative browser.
the tripple bottom was the signal, enough for the gamblers.... confirmed as the price went through the downtrend resistance line at approx 9740, hence 40 as the entry. Nice stop available just below at 29 so a nice safe entry. All it has to do now is deliver a decent reward.... but horizontal resistance looms at 80.
Bill
Active member
- Messages
- 160
- Likes
- 1
Blimey! Good call or what? 🙂
Thanks. Patience is a virtue and will be rewarded. Many trade just for the sake of hoping they get it right adn something to do. Not a good idea. I'm not keen to take undue risks and would far prefer to see some moves fly by, than hop on every bus that passes. Very hard to do.
Thanks. Patience is a virtue and will be rewarded. Many trade just for the sake of hoping they get it right adn something to do. Not a good idea. I'm not keen to take undue risks and would far prefer to see some moves fly by, than hop on every bus that passes. Very hard to do.
Hi chaps,
Not been trading recently - too busy with deadlines at work. I've just worked out that entries on things like a tripple bottom are not guaranteed - recognising the TA is good but it doesn't mean it's gonna do what the TA says. Sure, do what u think the TA indicates - BUT, put in your stoploss as CM did above.
It's that kind of strategy and discipline that will hopefully make u money - admittedly it's difficult to cut losses with the spread n bias but small loses are par for the course as long as u can capture the big moves like today - then the gambles become worthwhile.
I've found that I can work out the TA ok - but when it goes against me or when I get it wrong my stoploss strategy was either non-existent or I broke it. That's where the big losses come in 🙁
Now, I'll just re-read my post and hope it sinks in 🙂
CM - Has there been an exit signal? I see no ND but there have been 3 peaks on the up so should the exit have been at 9820? Or should it have been at 9800 which is where I think the downtrend resistance line is?
By the way it was nice to see both you and Skim in total agrrement about the entry!
No there wasn't the 3 pk ND top that I was expecting so I got caught unawares.... I guess the market got really carried away and the normal market forces got over-ridden.
By the way it was nice to see both you and Skim in total agrrement about the entry!
No there wasn't the 3 pk ND top that I was expecting so I got caught unawares.... I guess the market got really carried away and the normal market forces got over-ridden.
rossored
Senior member
- Messages
- 2,103
- Likes
- 56
Mombasa - what do you mean your s/l strategy was "non-existent or you broke it"? The best thing is to pre-determine how much you want to wager on a particular trade - mine is the same for every trade - and put the stop on at the same time as you enter the position. DO NOT move it afterwards ( well, dont move it further away, anyway ). If it gets hit, then it gets hit. So what? Half the times that it gets hit, you'll find that 10 minutes later the market will have turned around and gone in your original direction, but that's how it goes. The other half of the time it will save you a shedload of money. Thats also how it goes.
All the best
RR
All the best
RR
Chartman said it's a good bet. you're risking 11 points against a new low. Wish every trade was that clear cut. This is about trading, not whether it's "right" in TA.
Quite right. A nice clear cut 11 point risk- on the chart, not on the SB prices. The reward is an initial 24, up to the magic 24, as a guess, and 35 from the triangle, so 2:1, 3:1 ish.It was also "right" in my TA book. See my scribble later.
Quite right. A nice clear cut 11 point risk- on the chart, not on the SB prices. The reward is an initial 24, up to the magic 24, as a guess, and 35 from the triangle, so 2:1, 3:1 ish.It was also "right" in my TA book. See my scribble later.
china white
Established member
- Messages
- 979
- Likes
- 12
lower T/L held again.....
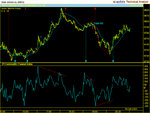
nothing much changes in the big pic IMO. Lower T/L was tested again (and again, and again.... :cheesy: ) and held. Same ND on RSI 60 min tho.....
I am a bit concerned with the extra-low readings of front-end volatilities. What I wud ideally like to c is a fake B/D of this U/T to scare the bulls, ideally down to 1038 (mega sup now). If that hap's and front-end volatility shoots up - then I reckon we'll have 10K.
Attachments
china white
Established member
- Messages
- 979
- Likes
- 12
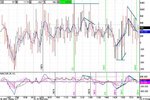
day of nice divergencies
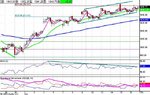
quite a lovely day for day-trading. the tricky bit was the top in the niddle of the day, when CCI was ND, but RSI 1 min WAS NOT. A clear signal came from TICK index (see chart below).
also note the latest ND in the last hour of trading did not deliver. the author was inclined to short there, but did not do so aware of the 2 bullish time frames coming at the close (green lines).
Attachments
Iv'e posted numerous replies above, they're in Italics. It keeps the Q&A's together to make for easier reading. I'm not sure if that will qualify as a "new post" so you'll have to keep your eyes on your own posts if you asked a question....
I'm not know for going short, especially at the open, but there seemed to be an opportunity today to take a shot at the pulback... The crunch was the stop to put on which needed to be at 9800 ...
Tracking the downfall produced some clear bottoms at the 32's. This developed into a) a triangle, b) a PD bottom and c) a triple/multi bottom. Good enough for as rock sure entry as you're likely to get. Plus, there was the extra safe entry at 40 on the downtrend resistance break, with the stop just below 32' at 29 ( nominal). The gamblers might just have taken the 3rd low..
Target here was two fold, first the magic 64 aas a matter of course and the triangle target at 75, T1. Is that a "woolfie" off the reverse triangle? That rev. triangle gave a 67 target.It also gave a support trend line off the peak at 75. Close here? maybe for those that have a nervous disposition. RSI had peaked big time so why not? Because CCI had just broken through zero so had room to move....So now we're looking for a hit at yesterday's downtrend res. line at 9790, but it just flew through, so now to look for an ND top for an out....Peak 2 came just below 9800 so now wait for the third peak. It came, but was not confirmed on RSI so I hesitated. Not seen this happen before... If you did the same, you should have got an out on either the failed support line on the 3 peaks slope at 9810 , or 9800 which by now was a screaming H&S top right shoulder. Nice chance for a reversal here. Sit that out till the PD bottom/bull flag and a 45 /50 out.
It'll be a tough call to make my comp target of 9900+ tomorrow...