You are using an out of date browser. It may not display this or other websites correctly.
You should upgrade or use an alternative browser.
You should upgrade or use an alternative browser.
Chartman. I've found your thread enormously helpful over the months. Thank you for that. Not really a TA thing but if things are going well in the closing session is there a rule of thumb for judging whether to close the position at the last minute or simply letting it go to settlement price? Or is it just not worth the extra hassle?
Regards
Regards
I hope it's a rising wedge, as I have a target in mind ( last week) of 9900.....
Kilnside- Holding till settlement ?. Do you mean after hours, or the Dec . Futs? I've never advocated holding overnight for daytraders. If your trading timescale is days, then I guess it has to be part of your TA as to whether you hold overnight or not. If, as I think, you day trade, I couldn't be bothered to hold into settlement. Take the cash and close.
Kilnside- Holding till settlement ?. Do you mean after hours, or the Dec . Futs? I've never advocated holding overnight for daytraders. If your trading timescale is days, then I guess it has to be part of your TA as to whether you hold overnight or not. If, as I think, you day trade, I couldn't be bothered to hold into settlement. Take the cash and close.
china white
Established member
- Messages
- 979
- Likes
- 12
what keeps me bullish
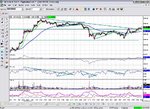
I don't want to read too much into a light volume action on a holiday, however I believe today's session is good for bulls. 1st, 1039-40 was tried twice and held, which supports the idea that we've got a strong sup there now (both from last week's price action, and a longer-term importance of 1038). 2nd, both intraday horizontal level of 1044 and downward res line connecting the intraday tops were B/O at the close (see chart below).
Generally it was a nice trading day. B/O at 10:05; tri B/D at 12:50, supportive vol spike at 13:15; R/S switch on RSI + PD RSI + PD volume at 13:30; tri B/D + ND RSI at 14:40; TRIN PD at 15:15 confirmed by small downward res B/O several minutes later - all clear cut signals IMO. The only tricky part was the 1st PD on RSI 1 min at 12:08 where the author doubled his longs. It did not deliver and caused some stressful minutes 🙁 However, the tri B/D that followed was quite clearly spelt - giving u a chance to reverse.
Attachments
china white
Established member
- Messages
- 979
- Likes
- 12
Balanced view as usual China. I thought I was the only one that sat on the fence🙂
My observation re the long term ND is this:- The dow will usually react to ND/PD within a few days (3 to 5 ish). After that, if it has not delivered, there is nowhere to go but up,( or down) RSI /CCI having fallen to lows that can't (!) go lower. There is a "W" bottom here , with a target of 9950...Time, as always, will tell.
My observation re the long term ND is this:- The dow will usually react to ND/PD within a few days (3 to 5 ish). After that, if it has not delivered, there is nowhere to go but up,( or down) RSI /CCI having fallen to lows that can't (!) go lower. There is a "W" bottom here , with a target of 9950...Time, as always, will tell.
china white
Established member
- Messages
- 979
- Likes
- 12
I o an apology to every1 for the size of my charts....
Skim, u gave me an advice how to make 'em smaller. Tried it, moving the bar on QCharts to about 60%, still same behemoths.... any suggestions? many thx
Skim, u gave me an advice how to make 'em smaller. Tried it, moving the bar on QCharts to about 60%, still same behemoths.... any suggestions? many thx
china white
Established member
- Messages
- 979
- Likes
- 12
just one more thing that crossed my mind. On Friday NYSE McClellan checked in at -3.51 which cud (with a prob of 75%) mean a negative mcclose on Tuesday. However, I checked the way the indicator is calculated - it is based on cash, and therefore does not acct for the last 15 min of futures trading which was very bullish as u wud recall. Therefore, I personally wudnt even look at this number positioning for the Tuesday's price action. Just a thought. Happy trading everyone!
China White, thank you for sharing your views. You've got my vote! Like Chartman's, they are very much appreciated. Thanks to NB's extract of Chartman's posts and daily study of this thread, I have been able to steepen my learning curve and thus (day)trading confidence. I do, hwoever, still struggle with some of your jargon and abbreviations. Perhaps you can help me with the ones in bold :
Quote
Generally it was a nice trading day. B/O at 10:05; tri B/D at 12:50, supportive vol spike at 13:15; R/S switch on RSI + PD RSI + PD volume at 13:30; tri B/D + ND RSI at 14:40; TRIN PD at 15:15 confirmed by small downward res B/O several minutes later - all clear cut signals IMO. The only tricky part was the 1st PD on RSI 1 min at 12:08 where the author doubled his longs. It did not deliver and caused some stressful minutes However, the tri B/D that followed was quite clearly spelt - giving u a chance to reverse
Unquote
many thanks
china white
Established member
- Messages
- 979
- Likes
- 12
absolutely right! 🙂
china white
Established member
- Messages
- 979
- Likes
- 12
CM - very well said! 🙂
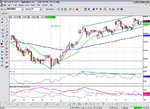
I am still experimenting with the charts' size (so I don't pester u with those behemoths). In the meantime - CM pls let me know if u r seeing the same - I believe a tri formed with the attic door of 1050 cash (1048ish ES) knocked at 3 times (on 60 min). The mouth of that tri is about 18 pts, so IF (!!!) it is broken to the U/S, we'll have a trgt of 1068ish - wud be a spot-on "measured move"!
Wanted to share something from today's battle log with u. Remember in the very 1st minutes of NY lunch a tri on ES was broken to the D/S, with a consequent retest of 9:45 LOD? I find this quite a tricky trading point (let's say it is about 12:10 EST). the reason is that at about that time there is an increased chance of large orders being punched in. The KEY to today's reaction to that Break-Down IMO was to spot TRIN PD divergence. TRIN wud b the 1st indicator to react to large selling orders (as it is volume based, unlike TICK). TRIN at 12:10 was significantly lower than at LOD @ 9:45 - PD!
Another clue why not to sell the tri B/D was that RSI 1 min stayed above the RSI sup line at 38 on this blip. However, it is my belief that at some certain times of the day (10:10, 12:10, 14:00 and 15:15) it is the volume-based indicators that r most meaningful. Unlike pros on the floor who can c client flow at those times, we need to somehow figure out if thez any big orders coming in at those junctures - making volume indicators the key. Hope u find this useful
- Messages
- 2,325
- Likes
- 17
China:
If the charts are still too big, then you need to resize the chart in
Qcharts first. Work out approximately how wide and deep you
want it to appear.
When you do the export in Qcharts it will export/replicate it in the
EXACT size that it appeared on your screen. So if the charts you
are posting are too big, it's because you must be looking at them
the full width of your monitor. I make mine about one quarter of
my monitor size, and those then fit reasonably neatly into the BB
postings.
I actually do File, New, Bar Chart and then resize it, and then
export it. And then I delete the new chart I created in Qcharts.
The percentage amount is just the resolution of the actual chart,
not its size. 😀