You are using an out of date browser. It may not display this or other websites correctly.
You should upgrade or use an alternative browser.
You should upgrade or use an alternative browser.
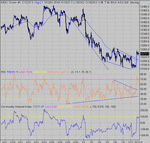
Patience is the name of the game sometimes. That second peak at the open was worth a short as it failed 32 and showed ND. Plenty of opportunities to get out as the price bounced multiple times off 64.... and in the process brough the triangle setup into view.... The third low was the one to look for..... by which time T1 should have been easy to calculate for the expected break. One of the better 7pm setups I've seen in a while, giving 70-80 points. Plus a few off the short to squeeze a ton, just.
Attachments
Hi CM
managed to get the short at the open, but waited to break the 100ma first cos I remember your warning ' beware the opening divergence. ' Got burnt by that before. Also got the long but got out real quick when I saw rsi hit 90 and cci hit 600+. havnt seen that before so thought it might indicate OS and didnt really know what would happen next. . Still a nice day for me but looking forward to ' squeezing a ton' myself
managed to get the short at the open, but waited to break the 100ma first cos I remember your warning ' beware the opening divergence. ' Got burnt by that before. Also got the long but got out real quick when I saw rsi hit 90 and cci hit 600+. havnt seen that before so thought it might indicate OS and didnt really know what would happen next. . Still a nice day for me but looking forward to ' squeezing a ton' myself
Hi Chartman,
I watched the DJIA all day today as it fell, went flat and then quickly rose again. I am an absolute novice and trying to understand what happened.
I have been studying some articles by jpwone (I don't know if you are familiar with him) and was trying to apply what I was learning to my trading today.
I took the advice not to trade in the first half hour and saw the two peaks before the price started to fall. I had guessed a fall was on the cards due to the business news but decided not to break the half hour rule and instead just watched. After 3pm (GMT) the price carried on falling but as there were no upward movements to give me a good opportunity to buy I ended up just watching the price move down.
I knew from previous experience that sometimes there is a move back up at around 7pm or sometimes a little later on and again guessed that the price might go back up but was not confident enough to trade straight away.
In the end I finished up making 21 points when I was confident enough to make a trade.
I was wondering if you might explain a few things I do not understand (I am sorry for my lack of knowledge)? I also apologise if these are dumn questions but I am very new to this and hungry for knowledge.
I looked at your charts and wasn't sure exactly what preference you use for plotting?
I was using the advice I had read which was to use 1 min candlesticks with a 10 period SMA, a 30 period EMA and a 60 period EMA.
I see your chart also has an "RSI" and "CCI" although I don't understand these, I will have to do some research tomorrow.
Please could you explain what you mean by "it failed 32" and also "showed ND"?
I take it you are refering to the fact that the price seemed to hit a support level at 10164 and this was obviously the time to exit the trade?
Please could you tell me what a triangle setup is?
I'm sorry but I am realy lost here! I assume you are drawing trend lines along the highs and lows and as they approach each other to form a triangle you expect the triangle to be breached?
Is this something that you see quite often, maybe once a week?
Congrats on making so many points today. I feel silly making only 21 but that's better than losing 21! And sorry for the long post, its very difficult being a beginner. I appreciate it if you re able to find the time to answer some of my questions.
Kind regards,
Justyn.
I watched the DJIA all day today as it fell, went flat and then quickly rose again. I am an absolute novice and trying to understand what happened.
I have been studying some articles by jpwone (I don't know if you are familiar with him) and was trying to apply what I was learning to my trading today.
I took the advice not to trade in the first half hour and saw the two peaks before the price started to fall. I had guessed a fall was on the cards due to the business news but decided not to break the half hour rule and instead just watched. After 3pm (GMT) the price carried on falling but as there were no upward movements to give me a good opportunity to buy I ended up just watching the price move down.
I knew from previous experience that sometimes there is a move back up at around 7pm or sometimes a little later on and again guessed that the price might go back up but was not confident enough to trade straight away.
In the end I finished up making 21 points when I was confident enough to make a trade.
I was wondering if you might explain a few things I do not understand (I am sorry for my lack of knowledge)? I also apologise if these are dumn questions but I am very new to this and hungry for knowledge.
I looked at your charts and wasn't sure exactly what preference you use for plotting?
I was using the advice I had read which was to use 1 min candlesticks with a 10 period SMA, a 30 period EMA and a 60 period EMA.
I see your chart also has an "RSI" and "CCI" although I don't understand these, I will have to do some research tomorrow.
That second peak at the open was worth a short as it failed 32 and showed ND
Please could you explain what you mean by "it failed 32" and also "showed ND"?
Plenty of opportunities to get out as the price bounced multiple times off 64.... and in the process brough the triangle setup into view
I take it you are refering to the fact that the price seemed to hit a support level at 10164 and this was obviously the time to exit the trade?
Please could you tell me what a triangle setup is?
The third low was the one to look for..... by which time T1 should have been easy to calculate for the expected break
I'm sorry but I am realy lost here! I assume you are drawing trend lines along the highs and lows and as they approach each other to form a triangle you expect the triangle to be breached?
One of the better 7pm setups I've seen in a while
Is this something that you see quite often, maybe once a week?
Congrats on making so many points today. I feel silly making only 21 but that's better than losing 21! And sorry for the long post, its very difficult being a beginner. I appreciate it if you re able to find the time to answer some of my questions.
Kind regards,
Justyn.
Flipper- waiting is no bad thing.... no point in jumping in to get burnt. You get nothing for being brave except and empty account..... CCI 600.... Just remeber that these indicators work on history and reflect what's happening now to what was happening x periods ago. CCI @150 is 2.1/2 hours ago compared to now, so if it was quiet then, and its rapidly moving now, CCI flies out the roof, ....
Justyin, I'll reply tomorrow, it's late...
Justyin, I'll reply tomorrow, it's late...
bansir
Well-known member
- Messages
- 494
- Likes
- 42
justyn said:Hi Chartman,
I watched the DJIA all day today as it fell, went flat and then quickly rose again. I am an absolute novice and trying to understand what happened.
I have been studying some articles by jpwone (I don't know if you are familiar with him) and was trying to apply what I was learning to my trading today.
I took the advice not to trade in the first half hour and saw the two peaks before the price started to fall. I had guessed a fall was on the cards due to the business news but decided not to break the half hour rule and instead just watched. After 3pm (GMT) the price carried on falling but as there were no upward movements to give me a good opportunity to buy I ended up just watching the price move down.
I knew from previous experience that sometimes there is a move back up at around 7pm or sometimes a little later on and again guessed that the price might go back up but was not confident enough to trade straight away.
In the end I finished up making 21 points when I was confident enough to make a trade.
I was wondering if you might explain a few things I do not understand (I am sorry for my lack of knowledge)? I also apologise if these are dumn questions but I am very new to this and hungry for knowledge.
I looked at your charts and wasn't sure exactly what preference you use for plotting?
I was using the advice I had read which was to use 1 min candlesticks with a 10 period SMA, a 30 period EMA and a 60 period EMA.
I see your chart also has an "RSI" and "CCI" although I don't understand these, I will have to do some research tomorrow.
Please could you explain what you mean by "it failed 32" and also "showed ND"?
I take it you are refering to the fact that the price seemed to hit a support level at 10164 and this was obviously the time to exit the trade?
Please could you tell me what a triangle setup is?
I'm sorry but I am realy lost here! I assume you are drawing trend lines along the highs and lows and as they approach each other to form a triangle you expect the triangle to be breached?
Is this something that you see quite often, maybe once a week?
Congrats on making so many points today. I feel silly making only 21 but that's better than losing 21! And sorry for the long post, its very difficult being a beginner. I appreciate it if you re able to find the time to answer some of my questions.
Kind regards,
Justyn.
Hi Justyn,
Well done with your profit and for being patient and disciplined!
I agree too, Jpwone has posted some great threads here and elseware.
Blimey, you've got a bit o' ground work to do mate by the sound of it! 😆
I'll try and point you in the right direction until some one with more experience gets back to you.
First off, I suggest you read this link which gives a good outline of CM's methods for trading the dow:
http://www.trade2win.com/boards/showthread.php?s=&threadid=5785
Also from what you say, it appears your knowledge of TA (Technical Analysis) has plenty of room for expansion?
Have a look around the TA forums on T2W and explore the links. You will learn a lot about chart patterns (incuding triangles)
and the principles of trend lines , support and resistance etc. ie. dow theory.
Just to get you started RSI refers to the Relative Strength Index.
CCI is the Commodity Chennel Index.
Both are indicators which may be used to confirm price movements -a subject under hot debate in some threads.
ND and PD stand for Negative and Positive Divergence respectively, the linked document above should answer your questions wrt these.
The 32 / 64 thing refers to an empirical fact that very often it seems that support and resistance lines act at these levels thus:
During the first half hour today we may have expected the price movement to bounce back off a test of 10232 because earlier experience has shown that any level ending in 32 or 64 tends to offer support or resistance, (I know, I know, don't ask why! 😕 ).
If you really want to get into full blown TA (which is a fascinating subject, by the way) I would recommend you get hold of a good book such as JJ Murphy's "Technical Analysis of the Financial Markets".
Have fun, you will learn loads just reading CM's daily commentary right here!
All the Best,
Neil
bansir
Well-known member
- Messages
- 494
- Likes
- 42
ChartMan said:Patience is the name of the game sometimes. That second peak at the open was worth a short as it failed 32 and showed ND. Plenty of opportunities to get out as the price bounced multiple times off 64.... and in the process brough the triangle setup into view.... The third low was the one to look for..... by which time T1 should have been easy to calculate for the expected break. One of the better 7pm setups I've seen in a while, giving 70-80 points. Plus a few off the short to squeeze a ton, just.
Hi CM,
Just an observation, pretty obvious to some maybe, in relation to today's action.
During the boring, narrow range period 11.32 ish to 13:56 ish ES`U volume was down around 4000. I therefore read this as a fueling up level for a possible later move.
As the accumulation continude I began to think this can't be accumulation, it's just stone dead. I confidently walked away at 13:58 thinking nothing on the cards now 🙄
Thing is, does the time length of an accumulation period translate at all into a vertical target for the (eventual) price movement? I guess P&F charting may take this sort of thing into acount??
Thanks for your posts CM.
Best Regards,
Neil
Neil,
thank you for being kind enough to reply.
This is a constant learning curve for me but I am learning every day. I'll be reading that link you sent me now and will be trying to analyse the day as it unravels again today. Hopefully I will pick up a few points but I have already learnt that its best not to jump if if you are in any doubt, there is always another opportunity.
I have already read about support and resistance, it's another thing having the experience to know how to apply these.
Thanks for the tip regarding 32 and 64 - could this be anything to do with them being two to the power of 5 & 6 respectively?
Justyn.
thank you for being kind enough to reply.
bansir said:Blimey, you've got a bit o' ground work to do mate by the sound of it! 😆
First off, I suggest you read this link which gives a good outline of CM's methods for trading the dow:
This is a constant learning curve for me but I am learning every day. I'll be reading that link you sent me now and will be trying to analyse the day as it unravels again today. Hopefully I will pick up a few points but I have already learnt that its best not to jump if if you are in any doubt, there is always another opportunity.
I have already read about support and resistance, it's another thing having the experience to know how to apply these.
Thanks for the tip regarding 32 and 64 - could this be anything to do with them being two to the power of 5 & 6 respectively?
Justyn.
Reading the Fibonacci thread, there was a comment about 32 being something to do with a fib number squared...... Whatever, I don't know why. I doesn't bother me. I just know that these two numbers often provide decision points- stay in, get out or get in.Much like USA stock prices have decision points around their whole numbers.
Quite often, there are good opportunities around 7 pm... You have the benefit of a fresh look at the day's action and quite often( like last night) there is a clear opportunity to make a good trade. This happens a few times a week, somtimes not at all. I just use the 100 EMA. and RSI 14 to make my analysis. Remember, there are no fixed ruale as to what indicators to use, and their settings. Some purists advocate no indicators at all, using just price and volume. IF you can go down this route, you will be far better off, but it's a very long road.My approach is simplistic, reasonably safe and can deliver good results, both in capturing big moves and staying safe in sideways movements.
Brush up on TA - buy Murphy's technical analysis of the financial marlets- an excellent book on TA with little padding.no doubt there are other equally good books on TA.
Bigbusiness
Experienced member
- Messages
- 1,408
- Likes
- 23
I have just checked and if this stays inside the current range, this will be the narrowest trading range for any day this century. Not sure if my numbers are correct but I can't remember ever seeing a day with this narrow a range. The breakout could be interesting.
Last edited:
Bigbusiness
Experienced member
- Messages
- 1,408
- Likes
- 23
Just 26.47 range. That is the smallest I have seen and I will have to look at the previous decade to find the last time it was that low.
I fancy a false breakout tomorrow followed by a nice move but that is just a guess.
I fancy a false breakout tomorrow followed by a nice move but that is just a guess.
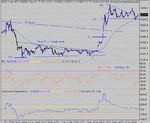
Yes very narrow. Not sure if there is any significance in a single occurance. One swallow doesn't make a summer. But let's see what happens in the next couple of days. We know that theoretically, we should get a good move. The thinly disguised triangle of today's action only points to a 25 point move- hardly exciting, even if it comes in one bar....
Look back a tad further over the last week or so... a reverse expanding triangle,maybe. Now we know they'll deliver a good move and this one points to 100+, just.
Look back a tad further over the last week or so... a reverse expanding triangle,maybe. Now we know they'll deliver a good move and this one points to 100+, just.
Attachments
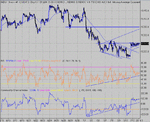
A terrible day for trading. Here's where the 100MA rules ! OK.
OK so it's 100 % utterly totally boring, but you DON'T LOSE money. OK, you may not get out of the one trade at a profit, but You don't get whipsawed either. I wish I had this under my belt when I first started out Dow trading. I lost count of how many times I got caught out. After several whipped trades, I was over 100 points down and the price hadn't moved a cent!!!!! And it wasn't just the once...... That's one of the joys of a spreadbetting account and some "bias". :cheesy:
There were a few options today, with plenty of safe exit options. Taking the open divergence, as yesterday, gave multiple outs on the 32 bounces. Going long of the 32's ( four of them) gave numerous outs, with multiple touches at 250 for a few points.
As I have said before, don't panic whilst the price is inside the 100MA +/- 20. Sit and plan an exit. ( Not strategy- you have that already - Plan the exit price. You'll have all the time in the world to get it right. And it's good practise too. You never need to be sitting all day with a trade inside the 100MA band. Take a planned exit and look for the next move. Do some homework. Do anything but sit all day watching your trade go up and down by 10 or 20 points
Attachments
outsExit the trade when the price has broken the 100MA in the opposite direction PLUS 20 points
IF you are in a trade AND the price is within + or - 20 points of the 100MA, DO NOT EXIT a trade.
Bansir, should the above read "when the price is outside + or - 20 points. ?
IF you are in a trade AND the price is within + or - 20 points of the 100MA, DO NOT EXIT a trade.
Bansir, should the above read "when the price is outside + or - 20 points. ?
bansir
Well-known member
- Messages
- 494
- Likes
- 42
eddyjo said:outsExit the trade when the price has broken the 100MA in the opposite direction PLUS 20 points
IF you are in a trade AND the price is within + or - 20 points of the 100MA, DO NOT EXIT a trade.
Bansir, should the above read "when the price is outside + or - 20 points. ?
Hi Eddyjo,
No, don't think so anyway.
It's designed to stop you getting repeatedly whipsawed.
So lets say you're long having got in as the price broke up through the 100ma at 10,200.
Now you just sit tight for a bit but the price moves against you to 10,185. If we assume the 100ma remains flat at
10,200 then don't exit at this stage because you're only -15 points under the 100ma.
The price moves back and carries on up to 10225, (100ma still flatish). Now you start to look for a good exit signal
because the price is outside the 100ma+20 range.
The exit signal may be negative divergence on the RSI or a familiar top reversal pattern or whatever.
Have I got this right CM? 😕
Hope this helps Ed,
Neil
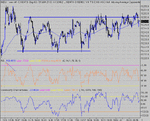
Not quite Bansir.... as the price goes OUTSIDE the 100ma+/- 20, you SHOULD exit a losing trade. If it is a winning trade, you start to look for measured moves and clear exit patterns, typically a 3pk ND top. Whilst taking your move,you need to allow for up to 20 point pullbacks .IF the move is meteoric, i.e 100+ on the table, you may need to take 30 point pullbacks to capture the full move . ( fairly infrequent).
There is a downside to this 100 MA rule. If the general price is drifting in one direction slowly, and is going against you, sooner or later your losing position size will slowly get bigger and bigger. This you are going to have to sort out according to your pain threshold and make your own exit rule, say absolute loss will be 35 points....
Take yesterday. If you went short at the worst possible time, @ 230 (15:22) You can see that by the end of the day , the 100 MA had risen from 235 at your entry, to 246 at the close. If the slope had been a little steeper, it is easy to see that the 100 MA + 20 price would never have been breached, but may well have been at 260/270, 40 away from your entry.
Hope this helps a bit more.
Bigbusiness
Experienced member
- Messages
- 1,408
- Likes
- 23
Bigbusiness said:Just 26.47 range. That is the smallest I have seen and I will have to look at the previous decade to find the last time it was that low.
I fancy a false breakout tomorrow followed by a nice move but that is just a guess.
Not a bad guess so far 🙂