Dow Intraday charts 10/11 - 14/11

ChartMan said:
Up tomorrow. 9780 resistance to breakout.

100% correct and almost the magic 'ton' in my bin!! Thanks CM!

Another 'handbrake turn' and the magic 10k must be within reach now?!?

It amazed me the way it flew through previous S/R levels and the RSI/CCI strength never wavered........

Hope you all had a profitable day!

Regards
 

Attachments

  • bull_whatever.orig.gif
    bull_whatever.orig.gif
    3.9 KB · Views: 631
Tradesmart, Sorry you didn't get the ton. Was your entry late, or did you close early?
 
Watched it for a little too long before getting in CM, and then it was up, up and away.....

but, Hey! - "greed is the enemy" as they say!

Hope you made the 'ton'....... :cheesy:

Regards
 

Attachments

  • next_bull.01.gif
    next_bull.01.gif
    3.8 KB · Views: 653
I forgot to mention that the magic 64 would provide an entry....
Still, nice to see the clear break and loadsa points.For the 10 min traders, you must take notice of the divergent bottoms after two days, or during the second day. Watch out for a bottom not connecting with the lower support line, as happened. Next move is a tough call, as we're heading for a triple top.OK if you're already long, but an entry now would require an out at any weakness towards 9880, if you want to stay on the safe side.. Support is at 9832 and 9800...
 

Attachments

  • dow 12-11-03 10.gif
    dow 12-11-03 10.gif
    32.5 KB · Views: 442
A nice entry at 32. Forget 64 off the 10 min charts.... :cheesy: Well, maybe not if you didn't fancy taking a gamble at the open. Either way, a nice easy stroll in the park, where ever you got on the bus. Until the close, the biggest pullback was a mere 10 points. I guess that the failure to make 64 at the end of the day should have prompted a close, but being at the end of the session, it's not surprising it didn't go that last half yard....
I wonder what tomorrow will bring? First up has to be a test at 9880 for a triple top.- strange number.... Support , same as 10 min, 9832 and 9800.
If the triple top goes, we should fly. ES is very, very close to 1060 triple top too.
 

Attachments

  • dow 12-11-03 1.gif
    dow 12-11-03 1.gif
    23 KB · Views: 428
60 minute chart....Alternate view. Expanding triangle = high volatility= big move, so don't guess. Theoretically, there should be a big move. CCI could go down to support, OR it could develop into a bul flag. Either way, there seems room for 150 + points.
 

Attachments

  • dow 12-11-03 60.gif
    dow 12-11-03 60.gif
    28.6 KB · Views: 408
remember, after a good trend day the most likely is for a continuation pattern to develop the next day - ie a consolidation. We could see a tight whippy day today - be careful.
 
Nice call , Sid. Neither one thing nor the other.No volatility as suggested. Maybe tomorrow...
Not so easy to see here, but take a look at the ES 20 min chart. There are three "W"'s . The last two have delivered....and were bottoms. There is far more room to the upside than downside now on DOW on RSI and CCI.
 

Attachments

  • dow 13-11-03 10.gif
    dow 13-11-03 10.gif
    35.5 KB · Views: 355
A correction and back to Stauts Quo, having taken out all overnight stops.:) Did they take out the stops at 9800 too? I wonder.... Whatever, a long after 1 hour's PD and hold was the order of the day, with a close at the ND top/resistance at 9850.
 

Attachments

  • dow 13-11-03 1.gif
    dow 13-11-03 1.gif
    26.7 KB · Views: 338
screen print

hi, how do i get a screen print on t2w, please help, i have an interesting chart to post
hogs
 
press "print screen" key.
open paint or paint shop pro
press "paste"
edit image to be less than 1024x1000 ( approx ). I use 950 x 950 ish
save as .giff somewhere
on your poste, click browse and point to our saved giff, then hit reply. Dont forget to type your text first.
 
Hi CM/all,

Looks suspiciously like a cup and handle setup to me, ready to explode north........!

(however, last time I spotted a C&H the handle suddenly fell off, so will not go long prematurely :cheesy: )
 

Attachments

  • dow 13-11-03.jpg
    dow 13-11-03.jpg
    51.1 KB · Views: 304
CM

I went long at 15.50 on the basis of a double bottom and exit at 17.35 on ND. What clue or what did I miss to indicate that I should have stayed in? I did also think I saw a triangle giving a Target of 9835 but chickened out of that when I saw the ND.

Thanks
 
Good point. Although technically it was an ND top, it didn't have the usual attributes, ie 3 higher highs in the price. They do, almost always, look like a bear flag, as in the one between 19:49 and 20:21. Had the dip at 17:109 to 9816 gone down to 9810, a perfect bull triangle would have been formed, and no doubt you (we) would all have stayed in. You can't be critcised for sticking to the rules.There are the odd occasions where we get caught out, but by and large, you will be way ahead by sticking to the rules. This time, being caught out meant not making quite as many points as maybe there was...... not so bad.
 
CM,
Having studied various trend based systems earlier today, I wondered what made you decide to use 100EMA's as opposed to fe 100WMA. I just noticed that in this afternoons slide the difference can be quite significant. Is it a matter of being consistent using one measure ema or wma or a specific reason?

Thank you
 
I think it's a matter of being consistent. Post a chart with 100WMA and let's see what it says.... I have been experimenting with a different MA and so far it looks very good. I just need time to figure out the implications, and how to use it. It's no good just having an indicator and say buy>30 sell<70. That falls into the 50/50 bracket.....
 
I suppose today was the "high volatility. Shame it went the wrong way. :cheesy: The "W" didn't deliver either.Well, actually, it did on ES, *( the third smaller one) but didn't follow through so the big one has failed.Triple top at 9880 to finish the week , but where too next week?
 

Attachments

  • dow 14-11-03 10.gif
    dow 14-11-03 10.gif
    33.6 KB · Views: 304
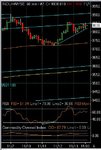
Nice short at the open after the first half hour.... a perfect triple top ... and a close on the PD double bottom at 9820 for a few points. The hard part was getting the next entry. Clues were the total weakness in the bounces off 9832 which in itself was another clue as it went from support to resistance. This often happens, so a short entry just after 19:00 as the price pulled back a tad towards 9832... After a long steady drop in RSI, you would expect the price to move up, clearly it didn't. It was welded to 9830/40. The first pullback around 9820 gave a target of T1. The second pullback to 9800 gave a target of T2 ( both from 9850 although you should have used 9840, being the last major high). Even so, the targets were met. So there we have 2 targets, all met, and on the second one, there was the 3rd peak to make a 3 pk PD bottom and an out for a nice bag full. Those on 5/10 mins would have bagged almost the whole move in one hit.....
Please remember how 32 and 64 form regular tests of support/resistance.
Here are the basic PD rules: At the open , if you see a 3 peak PD in a long drift down , don't go long on the 3rd peak!. WAIT until the price makes a higher high AND a higher low. Cover a short and take the points if you feel unsure. IF you have a decent profit from the short, consider waiting for the higher low before covering, or cover half and wait for the higher low to cover the balance. At any other time, take ( wait for) a 3 pk PD to confirm a bottom.
 

Attachments

  • dow 14-11-03 1.gif
    dow 14-11-03 1.gif
    21.9 KB · Views: 265
Chartman
Thanks for that. Patience is a virtue!
While I'm here, I've another question.
Where can I find some text on CCI? I'm pretty happy with the RSI principles and the info that it presents, but at the moment the CCI is really just giving me a pretty border at the bottom of my chart. (especially if I paint it passion pink or luscious lemon!!!)
I know I'm a hopeless case!
Cheers
Q
 
Top