You are using an out of date browser. It may not display this or other websites correctly.
You should upgrade or use an alternative browser.
You should upgrade or use an alternative browser.
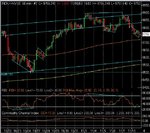
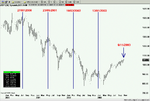
Two bear flags giving 9760 and 9756 as targets. Plenty of opportunities to get out on the base line, but nothing else for the rest of the day.The big bar at 19:30 looked full of promise, as did ES 1 min vol, but turned out to be just a Turkish Delight. :cheesy: Not a good day.
Attachments
tradesmart
Experienced member
- Messages
- 1,286
- Likes
- 22
Thanks for the above ChartMan - had a good day today, scored 3 out of 3, but I've reduced my stake so much I can afford to take risks; if I reduce it any more I'll be trading marbles....... 😉
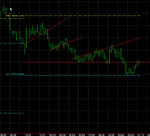
The 60min chart gives a slightly different take on the action - maybe us incorrigible bulls can anticipate a small bounce in the offing (for more than 10 points hopefully!) :cheesy:
Regards, TradeSmart
The 60min chart gives a slightly different take on the action - maybe us incorrigible bulls can anticipate a small bounce in the offing (for more than 10 points hopefully!) :cheesy:
Regards, TradeSmart
Attachments
Hi guys
I look forward your updates each day chartman have learnt a bundle over the months regarding patterns etc i do still stick my neck out though at times but with direct access and tight stops it normally pays of out of interest using the pivots seems to pay of again finding the bottom today i then took the final trade seeing a double bottom and snatched a handful of points to finish of with.
Best regards mark
Attachments
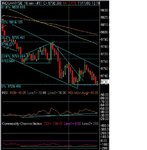
I have attached a chart with a harmonic cycle. It is basis this cycle that I say the high is in, and we are headed lower over the coming weeks. There is the chance of a spill=over, which would mean a double top in the Dow, but so far things look really good. The cycle came in on Friday, and I have been position short since. I am initially looking for a move below 1000 in the SP500 but I am fully aware of the potential for a bounce at this stage. I got the market being higher on Friday than where we are now. FWIW, as they say 🙂
Attachments
it is just a harmonic cycle that I came about by observation. Having said that, there is definately something in the round numbers...
more than one bear/bull market has started/ended on the round number anniversary in calendar days from previous bog higs and lows. If you are curious check out 1000/1500 days from 1998 lows.
And I am not back as I was never gone. I just dont have time to post so much 🙂
more than one bear/bull market has started/ended on the round number anniversary in calendar days from previous bog higs and lows. If you are curious check out 1000/1500 days from 1998 lows.
And I am not back as I was never gone. I just dont have time to post so much 🙂
Anyone trading the INDU this evening??
Waivering on a long, would rather have got in at 720 with a tight SL.
Is it a d'ble bottom, with aslightly higher low??
No golden xover of the EMA's-even in the 2min chart.
S&P still struggling just outside recent trading range1046/61
Where are we going folks??
Waivering on a long, would rather have got in at 720 with a tight SL.
Is it a d'ble bottom, with aslightly higher low??
No golden xover of the EMA's-even in the 2min chart.
S&P still struggling just outside recent trading range1046/61
Where are we going folks??
tradesmart
Experienced member
- Messages
- 1,286
- Likes
- 22
You might be right about the double bottom but I am not yet convinced as RSI ratio up is weak less 1/3 and there was no RSI ND. In past 20min, RSIU and CCI turned up but prices did not display new lows. Current rally appears very weak. May be a good sell opportunity? We' ll know shortly.
tradesmart
Experienced member
- Messages
- 1,286
- Likes
- 22
I've got a five minute plan.........!
Confucius, he say:- "In choppy markets, do not be afraid to trade - just take small profits frequently or have no beer money.....!"
This could well tank to c.9660 soon imho/dyor etc (coincides with lower rising trend line from March lows)
Regards
Confucius, he say:- "In choppy markets, do not be afraid to trade - just take small profits frequently or have no beer money.....!"
This could well tank to c.9660 soon imho/dyor etc (coincides with lower rising trend line from March lows)
Regards
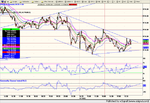
Lockstock, your timeycles seem to be a bit far fetched. As for the long term trend channel, I am currently concentrating on the short term. Is DOW going to break-out the down trend (and if so, will it be a false break-out) and what wil be the up target?
Tell me if you strong views?
Tell me if you strong views?
Attachments
10 & 30 EMA have just crossed 100 but now getting ND so I'm still staying out. Guess if one took a risk on the dbl bottom could have made a few points but it all looks very weak at the mo.
Yup, could go down to 9650 and still be in the uptrend - hate to think what will happen if that's broken !
Reckon the mkt won't do anything today - bond mkt closed and some kinda hol in the US?
Yup, could go down to 9650 and still be in the uptrend - hate to think what will happen if that's broken !
Reckon the mkt won't do anything today - bond mkt closed and some kinda hol in the US?
Hi all,
Bgold,
yep, you're probably right re. passage of time etc. I was just idling while this market decides where it's going.
Mombassa,
Thanx for the vote ( not that I usually take muich notice of them)
good point re: jollies. I find that the market usually rises on a holiday, light volume & all that.
See the UKX finished fairly strong,imho, we could mirror that.
Similar threads
- Replies
- 0
- Views
- 2K
- Replies
- 0
- Views
- 2K
- Replies
- 10
- Views
- 6K