Dow Intraday Charts 04 Oct - 08 Oct

Looking at the price and volume, there doesn't seem to be much stopping it going below 10,000 tonight - and staying there.
 
TheBramble said:
there doesn't seem to be much stopping it going below 10,000 tonight - and staying there.

Well, there seems to be some support around 10036 - 10040, so maybe not tonight? But it will certainly be interesting to see how the next week opens.
 
What I'd like to say....

Short from ND @ 3:00pm close @ 4:30pm from > 25mins PD +55
Short @ bear flag exit 10080 target 10050.exit 10050 +30 Total 85 [minimum.]
Nice easy day! :)

What actually happened...

Home after 5:00pm and actually saw a bear flag but not the one that finally materialised. So I took the short too early. Calculated the target as 10050 from the bear flag shown but bottled out far to soon. Then I saw pd, after the target had been met so went long only to see the price drop even more. Took another long after more pd and was very fortunate to close the last pair at BE.
You know I've been spread betting for nearly 3 years now and I should be much better than this. Will I ever get the hang of it?

+8 today

For the week: +6 | +22 | -7 | 0 | +8 = +29

So I won't be tellin my boss where to stick his job this week.. :(

Have a nice weekend everyone

Bill :)
 

Attachments

  • dow_081004.gif
    dow_081004.gif
    30.3 KB · Views: 207
Channel broke again with venom, producing H&S on the 20 min chart. All looks soooo obvious. :eek:
 

Attachments

  • dow 08-10-04 10.gif
    dow 08-10-04 10.gif
    35.2 KB · Views: 246
I saw it the same as you, Bill. I'm puzzled as to how/why you bottled it/..... Fear from having your stake too high? On the way down to the target ( I made it 48 so that was spot on) there was a second confirmation from the reverse triangle. Did you get out before that?
I can understand taking the first PD,but I would question it only because it was just under 64 for the third peak.... Surely worth a wait on a down day to see the re-test resolved( assuming it was going to happen( as it did). From there it went on to meet T1 and then T2. You could argue, of course, quite correctly, that the drop to 51 was in fact T1 ( for both your figure and mine). For the next step, having closed the short, I would still have waited to see how 64 resolved before taking another trade.The drop to T1 and T2 fell well within the normal pullback of 20 points, the biggest being 11. One must allow 20 points for pullbacks if you're going to capture the bigger moves.....
The time to close the short from the bear flag would have been a bounce of 64, failing to make T1....
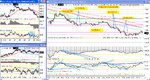
I've put up the Least Squares Moving Average ( 150) to show the benefits during a strong move. Still won't help you one bit in sideways action though.
 

Attachments

  • dow 08-10-04 1.gif
    dow 08-10-04 1.gif
    30.3 KB · Views: 269
TheBramble said:
Looking at the price and volume, there doesn't seem to be much stopping it going below 10,000 tonight - and staying there.
...I must increase the power of my incantations....
 
Friday 8th January 2004

Today will be an experiment taking trades from the 3m chart as recommended by several posters in the hope of getting a better balance between number of trades and profit potential per trade. No particular change in methodology except that I will be playing closer attention to the CCI with the following guidelines:

When looking for longs (price above 100 ema, CCI above zero line) I will not enter when we are getting lower lows on the CCI. When looking for shorts (price below 100 ema, CCI below zero line) I will not enter when we are getting higher highs on the CCI. These periods seem to correlate to the slow pullback/chop periods and for me are best avoided.

10:27 1) S 10129. No immediate follow through. Holding, holding. Then drops very well. Heading to 100 area and LOD. Stalls around 100 and although I've not had a clear exit I am getting very giddy with 30 plus points profit here.
11:03 EXIT: +30. Really wanted to get these in the bag.

11:24 2) S 10090. Right above LOD so risky. Just takes out LOD and then stalls. Not going to hang around here if it pulls back above high of a previous bar.
11:37 EXIT: +3

14:03 3) S 10070. Just missed entry before at 13:36 for a 20 point run so need a second push now. But it's not really going anywhere and potential double bottom with divergence at 65.
14:15 EXIT -2. Forced the exit as I did not want a loser but it turned straight down again and I missed the re-entry because of the (marginal) higher high on the CCI. Had I held the original entry it would have run 20+ before any exit.

Interestingly, the DJ index, ES and NQ all gave the earlier entry for the big run down that was not quite given on the YM. So my new filter kept me out on that particular occasion but it did also keep me out of the chop area from 11:30 to 13:30.

14:45 4) S 10051.Nice run into profit (+14) then sharp pullback for possible PD/TLB from O/S on RSI.
15:00 EXIT +15. PD on RSI from O/S.

Probably too soon again but it's Friday evening and I have to quit now to preserve domestic peace (!). A decent win on much better market action (please can we have more days like this) and I'm encouraged, but it could and should have been far better (40 possible points not taken after lunch on the first two pushes down). I didn't find the 3m as frustrating as I feared and will give it another go on Monday.

+46 from 4

+42 after commission for the day.

+14 for October so far after commissions.
 

Attachments

  • 20041008.jpg
    20041008.jpg
    288.5 KB · Views: 270
Trader Tony - I notice your 100ema is very high is that because it's a 3 minute chart and now represents 300 minutes. I know the TA is supposed to work in all timeframes but I would be most interested to learn how significant the +-15 lines are in the 3 min time frame. Oh just in case you were wondering I can only view 1 minute at the moment but I'm working on it.

CM -
I'm puzzled as to how/why you bottled it/..... Fear from having your stake too high?

Yes you and me both. As for stake please remember it's a CapitalSpreads simulation ATM.

Bill
 
Bill - I left all the settings exactly the same on Friday as previously on the 1m chart. However, it is interesting that other traders I know who use a 3m chart (e.g. some of the experienced traders in Woodie's room) are very fond of the 34ema which will give a similar line to the 100 ema on the 1 minute. MrM has made the same point to me and I will add this line on Monday.

T
 
Top