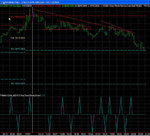
Just a quicky... the opening triangle that started at yesterday's closing peak gave a target of 9840. Cheak the relative RSI ratios on the two circled areas... The second bull flag at 9810 had a target of 9837, confirming T1. Still finding support on RSI 30 and bumping off 9832. Are the figures leaked out?????
You are using an out of date browser. It may not display this or other websites correctly.
You should upgrade or use an alternative browser.
You should upgrade or use an alternative browser.
tradesmart
Experienced member
- Messages
- 1,286
- Likes
- 22
Hi ChartMan/All,
I guess that we all have our own interpretation of the day's chart action to an extent, and I believe that you've mentioned this before yourself - I saw a PD double-bottom set-up and had no hesitation about going long at 9785.........the pattern of a weak open and a strong close has been repeated several times recently.
Regards, TradeSmart
Attachments
Last edited:
Hi CM,
That would be nice wouldn't it - I guess I should remortgage my house and go for it 🙂
Not sure how well the TA works long term - let see ...... good start with the break anyways.
On yesterdays action, I went long on the first pullback in the first circle u've drawn - got a bit worried when I saw what looked like a dbl/tripple top but stayed in because the RSI/Price ratio was very weak and it looked like a bull flag forming - trouble is there was ND as well (or looked like ND to me). So, I was a bit nervy at this stage.
Question - did that look like a dbl top to u? Do bull flags often look like dbl tops with ND to boot - how do u distinguish between a real dbl top and a potential bull flag? I made my fina judgement on the RSI/Price doodah.
tradesmart
Experienced member
- Messages
- 1,286
- Likes
- 22
UBS Warburg this week boosted its forecast for October payroll growth to 125,000, from an initial estimate of 50,000. The firm said the hiring of replacements for striking California grocery workers will add about 40,000 jobs, and that other recent reports point to an upside surprise.
but we don't gamble do we? - it's got nothing to do with T/A.. 😉
but we don't gamble do we? - it's got nothing to do with T/A.. 😉
All,
Which Dow Jones future/instrument would you recommend as trading vehicle in terms of liquidity and bid/ask spread?
I have been trading YM but experience at times lack of liquidity, especially pre-market. I was just partially taken out a long at 9867.5, very unfortunate (at least for now).
Thanks
Which Dow Jones future/instrument would you recommend as trading vehicle in terms of liquidity and bid/ask spread?
I have been trading YM but experience at times lack of liquidity, especially pre-market. I was just partially taken out a long at 9867.5, very unfortunate (at least for now).
Thanks
rossored
Senior member
- Messages
- 2,103
- Likes
- 56
Premarket liquidity on YM is dreadful, thats why. You should already know that if you're trading it! 😉 There is no Dow contract that is any more liquid I dont think : YM $5 increases in trading volume all the time according to CBOT, but if more liquidity is what you're after, then move to ES.
Anyway, liquidity has nothing to do with why you were taken out of your position.
Anyway, liquidity has nothing to do with why you were taken out of your position.
Bgold- premarket is a gamble and so sloooooow. YM is ok as is ES during normal trading hours. YM is ok for small lots as already mentioned.
MoM - Remember that all TA is made up of little bits and it works in all time frames ( sort of). So you are correct- it was a little double top, so we get a bit of down. We have a d/top at 9900 on the 10 min chart, so we got some down coming. Right now we just had a double bottom at 9860 so what part of a bigger picture will that become? Right now we have a potential bull flag on the 1 min chart. (16:10). Don't think of what you see as a "snapshot", try and think of what may be coming, to form something more significant. This bull flag may turn into a flat bottom triangle with a target of 9820. But first it'll test the magic 9864 which today happens to be at 9860 ( sounds contradictory!).
A quick look at ES and VOL suggests it wont go down......
I'll pass on this one- RSI is too low to take a short.
Commented elsewhere, 'didn't do what we expected, did it'?
A few possibilities to consider. At least a d/top at 9900. Maybe a H&S with double apex. Maybe a correction to the down channel, still maintaining the slope. Maybe none of these as the market just wants to screw us...... OK, I admit it,I spent the day looking for a long 🙁 I'm not telling you what I really think because I need the points in the comp next week. 😀
A few possibilities to consider. At least a d/top at 9900. Maybe a H&S with double apex. Maybe a correction to the down channel, still maintaining the slope. Maybe none of these as the market just wants to screw us...... OK, I admit it,I spent the day looking for a long 🙁 I'm not telling you what I really think because I need the points in the comp next week. 😀
Attachments
Depending on where you take the mouth of the open triangle you get T1 or T2...You could argue that T1 just made it, around 9832. The whole day just foxed me. First it looked like a false break to the down side,then a break and hold on 64, then I gave up. Or so I thought. Then I saw the PD bottom and decided to wait for the 64 break, which of course never happened, instead just dropping into the deeps. Did it make any sense to you?
Attachments
tradesmart
Experienced member
- Messages
- 1,286
- Likes
- 22
Foxed also CM! - broke the rules and scored with a futures long 9870-9930 and then got greedy and blew half my winnings on an ill conceived long which I had to pull......... 😡
Well, we have had plenty of warnings/examples that they were 'buying the rumour and selling the news' recently!
and that 'double top' clearly had major significance.......
They'll probably 'buy the news' next week when the price has dropped a bit....... :cheesy:
Regards, TradeSmart
ps- US quote:-
"I'm coming out feeling pretty good ... normally on Friday you get some profit taking," said Bill Roe, portfolio manager at Melhado Flynn & Associates. "People are still somewhat cautious -- and the more cautious they are, the more confident I am that the market is going to go higher."
hmmmm........
Last edited:
Hi Guys
We all read the market slightly differently no big moves but what i saw was two small triangles and the double top also i have just started looking at pivot points and have to say most days they work fairly well as you can see the market found support forming a triangle then broke through and again found support on the next level looking back historically there never more than a handful of points away from each turning /support/Resistance area .
Best regards mark
Attachments
Hi Neil,
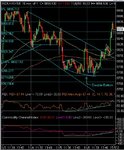
Well I was in at 9926 short, thought people would be selling into any spike today(yesterday), other than that ( not showimg on my chart) a double top at c.9910.
Also as the chart conveys, higher prices, lower indicators.
Also a 5min deadmans crossover on lower time frames & on this one a sharp move thru' the 100ema.
Cheers.