DOW - ES Charts 14/10 - 18/10

ChartMan

Legendary member
Messages
5,580
Likes
47
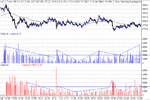
The dow crept upwards today without a sniff of a pullback to test previous levels.That makes me a bit nervous....Still WE have a nice bull triangle developed over the last two days trading.To go to form, I would have expected a breakout straight off the last bottom at 7800, but we got too close to the end of trading.Still, closeing near HOD should hold good for tomorrow.After hours trading is flat....(10:15) Conflicting signals on RSI and CCI so no real clear picture. CCI is holding a resistance whereas RSI shows an RS Switch.Losing the newly formed support on RS will signal a move to the downside as will going below zero on CCI. Interestingly, although CCI is showing at resistance, there is a clear Inverse H&S to be seen.Again, losing the shoulder support ( and that would be sub zero anyway, will signal down.
Note this is a 2 min Chart....
 

Attachments

  • 14-10-02.gif
    14-10-02.gif
    18.7 KB · Views: 558
Very unsettled trading today, with no major rallies or drops without neverending pullbacks to frighten all but the hardiest. A distinct lack of volume may suggest a lack of interest at this level.
Still , there is the bull triangle to consider.RSI and CCI don't show the same level of optimism as the dow, so we'll have to wait and see.... Going by traditional TA, we need a good rise in volume to break this out.
 

Attachments

  • 14-10-02.gif
    14-10-02.gif
    26.2 KB · Views: 568
Volume very thin today, with averages barely getting above the required 2K/min, bar early trading. We'll need more volume than this to breakout....
 

Attachments

  • 14-10-02vol.gif
    14-10-02vol.gif
    23 KB · Views: 573
Sky of Blue, and Sea of Green....... remember that song? Interesting discussions in the US chat room all afternoon...too much too soon, cant go up any more, I'm short etc.....there didn't seem to be many bulls around.I set my target already for this move up at 8400, and that's where I expect it to go. I don't care how or why it should or shouldn't get there.The thing is, until something tells me we've come to the top, why should I be thinking down? Don't we all keep telling each other "trade what you see"? Today I only saw up. Apart from the normal lunchtime blues, the volume today is exactly what I would expect from a supported breakout. Compare it to yesterday's volume.Today saw substantial levels and densities above 2K/min to sustain and support the move.True, the actaul trading day provided little to write home about, most gains coming overnight.The close looks interesting again,with a breakout of the day long 10 point channel.
Just as I am writing this, the ES has dropped 10 points (90 on the dow)- perhaps there has been some breaking news. That's screwed things up a bit :(
Anyway, the bottom line is that this breakout is on volume and we should have all seen it and acted accordingly.
 

Attachments

  • 15-10-02.gif
    15-10-02.gif
    20.4 KB · Views: 518
Here is why I set my target for this move at 8400.Yesterady's close provided an RS switch on RSI and there was an Inv. H&S on CCI . Recall I said these had to perform for the move to continue...I have seen this move before. I looked through the archives last night but couldn't find it. :( The final TA move was a 3 bull triangle "staircase", each gapping up the next day.Today's close has made another RS switch which, hopefully, will continue tomorrow. Unfortuanately, there has been an after hours drop of 100 odd points ... We'll have to wait until tomorrow to see how this pans out. If the overall move is valid, it will continue......
 

Attachments

  • 15-10-02.gif
    15-10-02.gif
    17.1 KB · Views: 533
Volume analysis. Doesn't look too much different to any other day, but the other ES chart clearly shows that it is. Remember to look at 1,5,10 min charts. That way you won't miss what's hidded....Today's key was with each pullback. The downtick volume could barely get any strength going. The first peak was rarely followed by a higher one, indicating no stomach for a fight nad so the bulls had their evil way. My worry is the apparent SR switch on the price trend line and RSI.....This is not showing on the DOW charts. Have I overstepped the mark and this is the start of the top?
Had the price rise continued on up after the close, instead of dropping 10 points, there would have been a switch back to support on the breakout afterhours.Tricky call now.
 

Attachments

  • 15-10-02vol.gif
    15-10-02vol.gif
    19.2 KB · Views: 515
Just a quick post for tonight. My PC myteriously "died" and has taken 'till past midnight to persuade it to go again :(
Anyway, After hours sees the DOW up over 150 post close.
 

Attachments

  • 16-10-02.gif
    16-10-02.gif
    17.4 KB · Views: 477
After hours continued to see the DOW on a rampant rise to 250 points above the day's previous close. The trading day provided consolidation and a rather boring trading session, but the confidence that we can move on up. Reason? The drop to RSI 20 and CCI -250 gives the clue... The DOW failed to drop on these low values indicating strength of the position. A drop of less than 1 point per point in RSI. Secondly, the close was at HOD with RSI at >70 and CCI >150.( Ignoring the drop at open)
It would be bvery nice for me if the DOW closed at 8400 tomorrow :)
I see after hours the dow is up another 90 points...
 

Attachments

  • 17-10-02.gif
    17-10-02.gif
    18.3 KB · Views: 410
What an aweful day for trading. Still, it's onwards and upwards and volume is beginning to sow up just how powerful an indicator it is. Bearing in mind this is relatively new to me as the DOW charts never gave me that opportunity. I wonder what I have been missing out on over the last 18 months.... Notice the substantial increase in volume at the end of the last two sessions and the following gap up in the price after hours. Could this be a reliable indiactor for taking what would otherwise be a gamble on holding an overnight position? The staircase step ups on the "5's" is still holding good with uncanny acuracy and predictability.
 

Attachments

  • 17-10-02.gif
    17-10-02.gif
    24 KB · Views: 405
Although the volume appears good, and the increase at the close leaads to a breakout after hours, it would appear that today's volume is down on yesterday. Could this be the signal that the move is coming to an end, I wonder? If the 5's theory is to hold true, and we are to move on up, we would want to see support at 885 tomorrow. I've posted a long term chart of ES elsewhere and this shows a strong triangle formation that has a target of 946 if it breaks out.....
 

Attachments

  • 17-10-02vol.gif
    17-10-02vol.gif
    22.3 KB · Views: 392
Well, I dipped out on the competition . We didn't hit 8400. :(
Never mind.The drop at the open killed it but in doing so provided a much better trading day with good volatility, mostly.Strange how the dow is "stepping" up..... now forming a bull wedge that broke out at the close. Looks like another one of those good Friday closes at HOD, giving strength going into next week.On the 10 min chart there is a nice solid steady up trend support established. Lose this and we'll head on down ....
 

Attachments

  • 18-10-02.gif
    18-10-02.gif
    17.8 KB · Views: 364
Undecided about this move. The volume is down and there could be an SR switch on the price that will lead to a drop.Or is the lack of volume weekend safety?
I'm going to show a different view of volume at the end- a point for thought.....
 

Attachments

  • 18-10-02.gif
    18-10-02.gif
    23 KB · Views: 374
Separated volume chart. You can clearly see the the good volume for the first 2 hours trading, then it fizzles out for the rest of the day.Stepping in the 5's again.
 

Attachments

  • 18-10-02vol.gif
    18-10-02vol.gif
    20.6 KB · Views: 363
New tack on the volume plots - for the Bulls. I guess if the volume plots were reversed, it would do for the Bears, but I won't go there. :) The up tick volume is plotted as a line, and the down tick vol is plotted as a bar. It's easy to see how the uptick line continuously encloses the down tick bars...... At 16:20, the down tick bars start to break above the uptick line and that, perhaps, is your exit.
 

Attachments

  • 18-10-02avol.gif
    18-10-02avol.gif
    14.8 KB · Views: 294
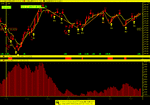
I like volume and run a 9 simple MA of the volume .. to see trends and a simple scan to see spikes. (the spikes are shown by the large triangles at the foot of the bar chart. the smaller triangles just show volume sincreases)
 

Attachments

  • spoos18oct.gif
    spoos18oct.gif
    24.6 KB · Views: 256
madasafish,

Great presentation, but any chance you can include an explanation of what the above means, and any implications that maybe deduced from it. Also, perhaps you can mention any clues through volume you get regarding (short term) future price movements.....

(Please forgive my ignorance...)

And thanks in advance....
:)
 
Top