You are using an out of date browser. It may not display this or other websites correctly.
You should upgrade or use an alternative browser.
You should upgrade or use an alternative browser.
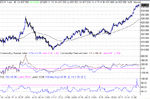
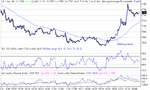
Sorry for lack of charts, but I've been overworked.🙁 Anyway, to catch up.... onwards and downwards is the order of the day. There is a target of 7750 from the bear flag and we have reached that. So what next? More of the same os is this a 3 wave abc pullback?......
Attachments

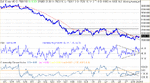
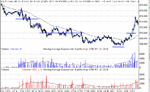
A nice day to trade the 100MA . Clear cut signals with no whiplash showing conviction in the moves. Unfortunately, and rarely, there was no real TA indication of the bottom at 7630. The cover would have to have been the break of the 100MA and pullback, simultaneously signalling a rare reversal trade.
Attachments
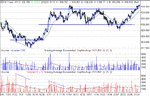
A nice bit of action in the later session, with 10 points on the table in a straight run with a 1.5 point pullback at 810 resistance. Running a 2 point stop woul have netted the lot. Failure to push below 805 could have been the signal to go long, in the absence of any divergence.
Attachments
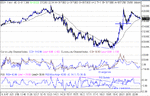
You can see the benefit of looking at ES futs. and the DOW. Whilst the dow failed to show any signs of a bottom, there were two clear signals on ES. The false breakout of the triangle on RSI and the CI divergence. The false breakdown would have been evident by the fact that the price failed to drop below 805. Then the confirmation came by way of the RS switch, but that becomes confirmed later in the move. Or you could have folled the 100MA as per the DOW......
Attachments
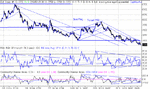
Just thought I'd post this, having looked at the 10 Min DOW chart. You can clearly see Positive Divergence in the 10 min chart, that was not evident in the 1 min charts. Nice easy 100 points for the longer term trader that prefers the 10 min charts.
Attachments
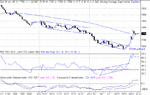
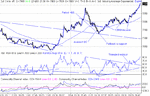
A lot of nice features today. Firstly, a failed H&S top. It failed because it didn't get to drop below its target of 7720. Bull sign no.1 Secondly, the inverse H&S that had a pullback to the 100MA after breaking its target(7816).The apex of that went right to the old downtrend resistance which is now support at 7726.Then we had a triangle breakout on RSI with two confirmation pullbacks to its old resistance line, and then away.This was not clearly visible in the price action.Closing at HOD is a good omen in the current climate, showing a willingness to hold over the weekend.
Attachments
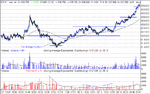
You can clearly see the lack of selling interest from lunchtime right through to the close. Note the total lack of sellers in the final ten minutes, where you would normally see the longs closing out their positions for the weekend. Shows confidence in next week's direction....
Attachments
Lack of definition in RSI and CCI fails to identify the triangle breakout that was evident in the DOW. Just adds to my conviction that you will do better if trading either the DOW OR ES, to keep an eye on both. What you miss on one, you will invariably get on the other.When things are looking like happening, ES volume will usually have the answer.