Dow analysis...

ChartMan

Legendary member
Messages
5,580
Likes
47
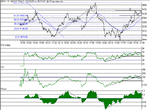
Well there's good news and bad. The flash rise to 9470 signalled things to come. A double bottom at 9400 and another top at 9470 was about all the action there was, providing a 75 point trading channel.On the 10 min chart, we can clearly see the up trend lines have been broken, so now we must look to the downside. 9600 now looks nothing more than a distant dream. The new dowwntrends are showing negative divergence, however,the "normalised" rising trend line is not yet broken...
The highs failed to reach the 82% fib by some 20 points and now we must look for support at 9400,then 9333.This may be sideways consolidation,but it's not looking good for the bulls.Tomorrow will bring a clearer picture, one way or the other.
 

Attachments

  • dow051101.gif
    dow051101.gif
    16.6 KB · Views: 632
Maybe the hinted at rate cut tomorrow will give the DOW some support...Expected at 7:15 pm UK time. Estimated 1/2 %, a few suggesting 1/4%.....
 
Tuesday's DOW Update

Surprise ,surprise.This is turning out to be Mr unpredictable...
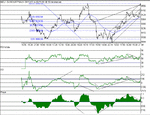
The 9400 crucial point got held at the open , and we ditherd till 7:15 pm between 9410 and 9430 and down to 9400, dropping to a low of 9388- guess that was a faker :) .And then it was fireworks night again.But not before another serious test, doubletopping at 9480 and dropping to support at 9410. Most must have thought it was all over....but PHASE never quite made it to zero, giving hope, and sure enough it was off to the blue beyond.82% Fib was bypassed in a flash at 9500 and my target from last week of 9600 was touched.How lucky.
I think we were expecting a blip up and tank, so I guess we got that one wrong.
Still too hard to call, but the fininsh was one of the strongest I have seen for a while so I guess onwards.Stong support now proven at 9400 (62%), untested support at 9500,with just a whisper from 26/10.
back in time, there was support at 9400 on 21/03 and 9500 on 03/04, part of a major double bottom.9600 support was last seen on 7/9 and 10/9, just before that fateful day.
The gap there is now all but closed, and tomorrow should see an incursion into that area. My only concern, once again,is that the rise was too steep too quick.If this is a genuine reflection of the market, then it will be sustainable.If not, you know where it's headed.
See the next thread for EOD Fib Charts and a surprise or two...
 

Attachments

  • dow061101.gif
    dow061101.gif
    17.3 KB · Views: 470
Fib Retracements DOW EOD

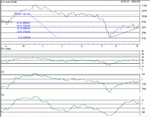
EOD chart for DOW Fib. Retracements. Here the 50% point approximates to the recent 10 Min charts' 50% retracement!
Intraday support has been near the 32%, with todays final peak beaing at the 63% retrace value of 9595. I guess 9600 will be pivotal tomorrow- Blow or bust...
 

Attachments

  • eod061101.gif
    eod061101.gif
    11.1 KB · Views: 499
The DOW today

No surprises today then. Basically downhill all the way with a couple of consolidation/rallies to keep us on our toes, but no advance.The question is this. Was today's lacking due to profit taking, or genuine market sentiment that yesterday's rise did not represent "fair value"? Support was established at 9545, and 9580 and then the 9580 turned into resistance.My feeling is that we are headed back to support at 9500, unless 9545 holds.Given today's weakness, 9500 seems more realistic and that is a weak support.
If we assume that 9641 is a top and the "normalised bottom is still 9079, we can theorise the likely drop points to follow:-
82% = 9540
62% = 9424
50% = 9360
38% = 9300

Today's established support at 9545 supports 82% at 9540...
Prior support has been seen at 9424 and 9300
Prior resistance seen at 9360

If you believe in Fib points, then these values cross correlate and suggest a valid top at 9641. The 100MA is at 9502 and this is where overcooked rises head for. As ever, tomorrow will give more clues....To me 9500 seems to be in "no man's land".
 

Attachments

  • dow071101.gif
    dow071101.gif
    17.4 KB · Views: 417
Dow Channel lines

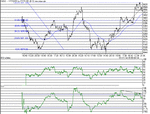
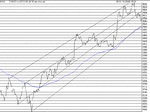
I'm interested in these lines....There are clear suport/resistance lines here providing a 4 parallel trading channels.Using the theory that history repeats itself, it's reasonable to assume , until broken, that the DOW is likely to trade inbetween these channels...
 

Attachments

  • dow channels 071101.gif
    dow channels 071101.gif
    11.7 KB · Views: 415
Tonight's DOW

A quick blast to test 9700 and all the way back down to 9563 , finally closing at 9588. From a strict TA point of view, we are still making higher highs, and higher lows. Doesn't look or feel like it, does it?
The general out look is not good, until you look at the EOD charts, where there is still room for rise to 9800/.
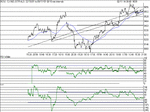
1 and 5 min charts moved into negative teritory on the Phase indicator, with the 10 min chart sitting on Zero. I think back to 9500 looks a good bet before moving on.
The lower of the four tramline trend lines was broken, but with a close just above the 100MA. Velocity plot shows signs of the downrtend reversing as it did at the close yesterday, so maybe we won't drop, but instead rise to the second trend line up, taking us beyond 9700.
Drop or straight continue the uptrend...hard call.
 

Attachments

  • dow081101.gif
    dow081101.gif
    14.8 KB · Views: 398
Friday's Dow

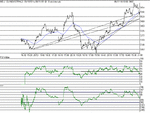
Well, we didn't rise to the second trend line at 9700. All in all it was a dreary day, but showing a steady gain to 9606,closing up 20 points. This close is at exactly the same value as on the 7th and 10th Aug nad the "gap" is now fully closed. We saw resistance tested 4 times at 9600, and a clear bull wedge is forming on the 1 min charts. If the next test braeks through, we should rally. The whole day was spent dithering around the 100MA, and we can now look to further gains next week, based on the fact that we are still making higher lows, and no major support levels have been breached.OK I know we haven't made higher highs, but I feel that will come. The bull wedge will (should) give rise to a 100 point gain to 9700. At that point, we get critical and have to breach it significantly to continue the rally.
Further, there exists the possibility of an H&S forming, 9640/9715/9615 ,but It just doesn't have the classic form, so I'll dismiss it as a real possibility.
The slope of the rise is realistic and sustainable, unlike previous violent rises, adding strength to a continued trend, RSI and CCI trends both confirming the current uptrend.
There are two possible rising trend lines, both shown, both of which are, in my opinion, equally valid.The lower one puts the current rise going up on the support line, the upper one showing the rise riding up resistance, the channel width being 80 points.
My overall feeling is that the previous steep trend has now lessened to a more realistic sustainable rate.
The key points next week will be :
A sustainable level above 9700 is required to continue the uptrend.
Pivotal support is 9550, below which we tank to the 9400 area.

The week closed up 283.
 

Attachments

  • dow091101.gif
    dow091101.gif
    14 KB · Views: 403
Top