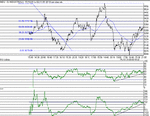
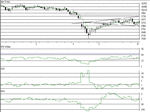
Well, we didn't finish the week at 9550, ending the week down 220 or so. There looks to be good signs for more up side in the short and longer term. The RSI and CCI slopes are showing a steady rise and should continue.It's got two wasy to go: Pullback to 9275 (38%) or straight on through 50% towards 9400. I was surprised to see the 50% fib point tested twice towards the end of the day (9333)as this is unusual in my observations from the past.I guess we will head back to the 38% line at 9275 or so, and perhaps then another assault on 9550.
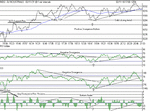
The EOD chart is developing an interesting reverse triangle.The lower line ends today at 8950 and the upper line ends at 9750. Is that where we are headed? Friday closed some 50 odd points above the 7MA,indicating more upside strength.Most other indicators have moved into bull territory, thanks mainly to the small, but continued rise from Thursday. RSI has mover to 51 from 49, Momentum has just turned positive ( genreally a solid buy signal) and there is a substantial move in MACD OSC,relative to the last 3 days. The 100 MA line is relatively close to the action, showing a less volatility over the last few days which, ultimately , is more sustainable.
Having tested 9275 three times on the recent rise, I see this as a reasonable support line, with 9200 below that.
To the upside, 9400 is the 62% retrace point where there should be some action, and then ( if it breaks) we'll get on to test 9600 again. At that point, we can look to moving on to test the expanding triangle point , currently at 9750, extrapolated out 1 week to 9850......where interestingly , we find a conveniently placed horizontal resistance line from 30/08 to06/09.
Barring unexpected bad news, that's my best guess....onwards to 9600.


