You are using an out of date browser. It may not display this or other websites correctly.
You should upgrade or use an alternative browser.
You should upgrade or use an alternative browser.
Dow 2009
- Thread starter N Rothschild
- Start date
- Watchers 65

VANTERHEYDEN
Junior member
- Messages
- 40
- Likes
- 2
after yesterdays expected sell off - the markets seem to be taking a bit of a breather.
The sell off is likely to resume but how long it will reflect on this is anyones guess.
The sell off is likely to resume but how long it will reflect on this is anyones guess.
solentsurfer
Active member
- Messages
- 110
- Likes
- 3
after yesterdays expected sell off - the markets seem to be taking a bit of a breather.
The sell off is likely to resume but how long it will reflect on this is anyones guess.
If it goes down through 7800-7780 looks like free air to around 7450 - although I'm trying not to get wedded to the idea that it's going further down just yet. Out of yesterdays shorts and just watching.
exportdealer
Junior member
- Messages
- 34
- Likes
- 20
Short now?
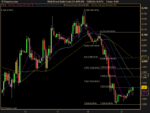
Posted this on potential setups earlier this morning, maybe of interest.
Dow CASH
All, yesterday was interesting and due to my overdoing it at the weekend manged to miss the action being tired, reluctance to catch a falling knife, twitchy trigger finger and inexperience I missed it.
My view (if its worth anything) is we should get another chance to get in this fall and it could continue through to the early 7300's before we take out the lows.
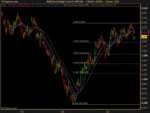
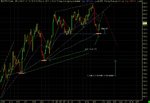
I've charted this in so many ways but decide to take all the lines off and keep it simple. The two charts below show 4h, recent rise, and 1h yesterdays fall. Taking simple fib 50% retracement of the rise on 4h we see 7329.5 as a target, lots of noise around that area.
To get in I am looking for a lower high on the 1h, lower low is already in. Looking at the 1h depending where you put the fib lines for the start of the fall I think the confluence around the 8000 level also being the round number and previous support and resistance of around 7995 it could be a good level to short if we get there, 7975 looks a little more convincing though.
But hey what do I know, good trading all.
Posted this on potential setups earlier this morning, maybe of interest.
Dow CASH
All, yesterday was interesting and due to my overdoing it at the weekend manged to miss the action being tired, reluctance to catch a falling knife, twitchy trigger finger and inexperience I missed it.
My view (if its worth anything) is we should get another chance to get in this fall and it could continue through to the early 7300's before we take out the lows.
I've charted this in so many ways but decide to take all the lines off and keep it simple. The two charts below show 4h, recent rise, and 1h yesterdays fall. Taking simple fib 50% retracement of the rise on 4h we see 7329.5 as a target, lots of noise around that area.
To get in I am looking for a lower high on the 1h, lower low is already in. Looking at the 1h depending where you put the fib lines for the start of the fall I think the confluence around the 8000 level also being the round number and previous support and resistance of around 7995 it could be a good level to short if we get there, 7975 looks a little more convincing though.
But hey what do I know, good trading all.
Attachments
solentsurfer
Active member
- Messages
- 110
- Likes
- 3
solentsurfer
Active member
- Messages
- 110
- Likes
- 3
Four words.... paint, dry, grass, grow!
exportdealer
Junior member
- Messages
- 34
- Likes
- 20
Four words.... paint, dry, grass, grow!
Short

Slapshot
Well-known member
- Messages
- 391
- Likes
- 32
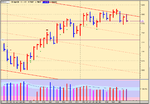
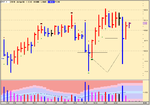
Just a quick update as we're half way through the week.
The attached chart is of the YM (futures) as I don't have EOD data for the cash yet but they're similar.
The weakness from last week took us down on monday to the 7800 area closing on the lows but the volume was down on the previous 3 days, which resulted in Tuesday being up after a dip below 7750.
Today, it's back up to have a crack at the upper trendline, and failed spectacularly, intraday there was a triple top, market collapsed in the last 40 mins finishing on the lows, with the volume this time increasing with the downside move.
Been a lot of volatilty over the past 3 days, 8000 is proving difficult very difficult to crack at present. The weakness from last week is still present.
EOD charts are not everyones cup of tea, I accept that, but with an understanding of where the strength and weaknesses in the market are daily will give you a good idea where to expect the bigger moves intraday and in which direction.
Good trading as always.
Attachments
Last edited:
KUTERO
Active member
- Messages
- 239
- Likes
- 17

Atilla
Legendary member
- Messages
- 21,115
- Likes
- 4,305
Just a quick update as we're half way through the week.
The attached chart is of the YM (futures) as I don't have EOD data for the cash yet but they're similar.
The weakness from last week took us down on monday to the 7800 area closing on the lows but the volume was down on the previous 3 days, which resulted in Tuesday being up after a dip below 7750.
Today, it's back up to have a crack at the upper trendline, and failed spectacularly, intraday there was a triple top, market collapsed in the last 40 mins finishing on the lows, with the volume this time increasing with the downside move.
Been a lot of volatilty over the past 3 days, 8000 is proving difficult very difficult to crack at present. The weakness from last week is still present.
EOD charts are not everyones cup of tea, I accept that, but with an understanding of where the strength and weaknesses in the market are daily will give you a good idea where to expect the bigger moves intraday and in which direction.
Good trading as always.
Interesting chart yesterday SlapShot. I agree about the 8000 area.
My previous sentiment was that if we retraced 7800 would be resistance. It seems to be holding. If we can now convincingly break through 8000-8200s I still hold the view some upside is a possibility. Possibly a break out from the resistance line.
This could be the last week for the bulls to push it further. It's not happening. I can't help thinking tomorrow being Friday we will see some major push up. If bulls don't show then bears taking over next week imo.
I have two targets depending on which side of 8000 we end up on.
Upside - 8400
Downside - 7500
Still a lot of wishy washy indecision. 😱 😗thumbsup:

Slapshot
Well-known member
- Messages
- 391
- Likes
- 32
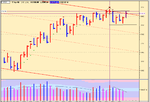
Depending on how long you hold positions for I'd be careful of shorting right now.
Intraday on the 10 mins we've have two massive shake outs, these are designed to mislead and hit stops. What makes me concerned about the short side is these down bars on massive volume have closed either in the middle or high, if that volume was selling the bar would have closed on the lows, which means serious buying took place at those key levels - 7960-70 area on the futures.
Looking at the Cash market, last friday we had a very narrow range on a marked increase in the volume, this took us down on monday, tuesday we tested the 7750 region and rebounded, wednesday back up above 8000 only to fall back, thursday another test of 7750 and rebounded. Today has been up all day but interestingly closing on the trendline and failing to take out last fridays, close or high AND significantly on volume less than the previous 4 days.
So how do I see things unfolding? Well, I expect the futures to push higher on monday with serious potential to fall once the US session opens, I'm also expecting a retest of the 7750 area at some stage.
Reducing volume up days approaching resistance lines/areas have greater potential to fall.
Overall, weakness still persists but be careful of higher prices on monday.
Have a good weekend all and good trading.
Attachments
KUTERO
Active member
- Messages
- 239
- Likes
- 17
Kutero...............
its break 8200 resistance... ?
🙂
you wellcome. 🙂
Looks will break on Monday according to indicators and moving average.. 😎
N Rothschild
Legendary member
- Messages
- 5,296
- Likes
- 603
im predicting new highs, cant remember the exact figure but think it was 8166 on the futures i calculated
KUTERO
Active member
- Messages
- 239
- Likes
- 17
im predicting new highs, cant remember the exact figure but think it was 8166 on the futures i calculated
I suppose, 8152 and 8166 will be resist for taking profit..😉
main resistance is 8200 as trend line. Also psychological..
and the next one is 8376..
and dont forget, "sell in may and go away " 🙂
N Rothschild
Legendary member
- Messages
- 5,296
- Likes
- 603
I suppose, 8152 and 8166 will be resist for taking profit..😉
main resistance is 8200 as trend line. Also psychological..
and the next one is 8376..
and dont forget, "sell in may and go away " 🙂
has nothing to do with resistance levels 🙂
Similar threads
- Replies
- 1
- Views
- 2K