francisfinley
Established member
- Messages
- 902
- Likes
- 46
embarrassing childhood accident ? 😀
exile why have you got grandma windsor on your avatar!! you crazy dude!
embarrassing childhood accident ? 😀
embarrassing childhood accident ? 😀
😆😆😆 Don't know about childhood but I've had a few accidents like that more recently mate and at my age you can't wash away the memories😱😱😱
PS Oranges move the bowels guys beware. Man of great experience here... :cheesy:
exile why have you got grandma windsor on your avatar!! you crazy dude!
'cos she's a Rangers fan too :clap:
sorry did someone say you could enter my thread rath? 😛
I heard she's a Chelsea fan!!! 😱
critical area..8282
W Pull the other one its got bells on it... :cheesy:
kuerto, not to be a dick..but cash market charts dont mean **** in my opinion..they dont show the true levels that are being traded out of hours.
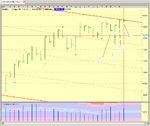
The dow is really struggling with the area of previous congestion I detailed in an earlier post(641).
Lets take a look at the chart and the the last 4 trading days.
1. A down day closing on the lows on a marked increase in the volume, increase in supply.
2. An up day which was marked down beyond the lows of the previous 2 days rallying to close on it's highs, BUT, the volume is less than the previous 3 days and price has been unable to take out the high and close of the previous 3 days.
3. The weakness is now confirmed, an up day which attempts to penetrate the resistance line (detailed in a previous post 641) closing off the highs. The volume is less than the previous 4 days, bullish bars don't look like this, there is a lack of demand to the upside.
4. This is a weak bar, a narrow range to the day closing in the middle and below the resistance line. what brings this bar to life is the increase in the volume. The volume is healthy, not low and not excessive. So we have a narrow range (high-low) with an increase in the volume and a failure to push through a resistance line, something is potentially capping that move, supply.
In my opinion this market now looks weak and I would be very cautious of looking to the long side. The prevous area of resistance to the left (see previous posts) is going to require a substantial effort to get past. I expect next week to be down, but as with any liquid market the dynamics can change very quickly which is what makes this fun.
Happy trading and have a good weekend.
I like your analysis my friend
different perspective, keep it up
I'm an avid reader
what would you say to the following formula chaps
low volume = lack of conviction
What if you are not a dick and you don't trade out of hours like some people??? :cheesy:
The dow is really struggling with the area of previous congestion I detailed in an earlier post(641).
Lets take a look at the chart and the the last 4 trading days.
1. A down day closing on the lows on a marked increase in the volume, increase in supply.
2. An up day which was marked down beyond the lows of the previous 2 days rallying to close on it's highs, BUT, the volume is less than the previous 3 days and price has been unable to take out the high and close of the previous 3 days.
3. The weakness is now confirmed, an up day which attempts to penetrate the resistance line (detailed in a previous post 641) closing off the highs. The volume is less than the previous 4 days, bullish bars don't look like this, there is a lack of demand to the upside.
4. This is a weak bar, a narrow range to the day closing in the middle and below the resistance line. what brings this bar to life is the increase in the volume. The volume is healthy, not low and not excessive. So we have a narrow range (high-low) with an increase in the volume and a failure to push through a resistance line, something is potentially capping that move, supply.
In my opinion this market now looks weak and I would be very cautious of looking to the long side. The prevous area of resistance to the left (see previous posts) is going to require a substantial effort to get past. I expect next week to be down, but as with any liquid market the dynamics can change very quickly which is what makes this fun.
Happy trading and have a good weekend.
I think the market is fixed and manipulated and thus next week we'll continue the rises as it seems most people are expecting the Dow to fall. I'd reckon (being contrarian here) we have one more week upside with a test of 7800s perhaps in May.