You are using an out of date browser. It may not display this or other websites correctly.
You should upgrade or use an alternative browser.
You should upgrade or use an alternative browser.
lurkerlurker
Senior member
- Messages
- 2,482
- Likes
- 150
Short on sep dow 13468,40 stop looking for 100 points
Good man. I've done a paper short since I've finished real trading for today.
Short YMU7 from 13570, stoploss 13590, target 13540 (or MOC)
out at 13346. +40. Possible short forming...
I do hope you're right there Kevin! I 'think' I went in a bit early. Isn't hindsight a wonderful thing?
Short again 75 - pleeeease go down!
Atilla
Legendary member
- Messages
- 21,111
- Likes
- 4,301
Hi guys,
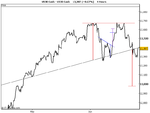
I have been watching the markets and picking up the odd pip here and there. However, I'm seen H&S where ever I look and it's becoming obsessive.
This is another I had picked out as a possibility and I have been watching it play out.
If the DOW doesn't break out of 13400 convincingly and start going back down below 13300 then I will be shorting it with double normal pos size as I feel almost certain it will retrace all the way back down to 13000 levels.
This is a messy H&S. Also, the left shoulder is almost at the same level as the head so if it carries out above 13400 I suspect it may go onwards and forwards to 13700 and this time break it. Also, Stochastics and MACD looking bullish but price shows otherwise.
Next few couple of days or hours is going to be quite spectacular. 200 pips one way or another.
If I had to stick my neck out, I'd say it was going to dive. I'm 60 / 40 bearish. Will let the charts guide me.
Good luck everyone.
Attachments
Last edited:
lurkerlurker
Senior member
- Messages
- 2,482
- Likes
- 150
Good man. I've done a paper short since I've finished real trading for today.
Short YMU7 from 13570, stoploss 13590, target 13540 (or MOC)
I got stopped out for -20. Wasn't paying attention. Trade was "wrong" when the high got taken out at 20:10 (13483)
Short on sep dow 13468,40 stop looking for 100 points
Out for -40
tafita
Guest
- Messages
- 191
- Likes
- 23
Good evening
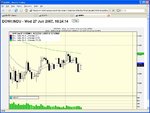
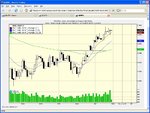
Some excellent opprtunities again today on the Dow. The first of two trades today saw a short entry as per CHART1. (All charts are 5 minutes). The price had breached support on increased volume and it was just a case of waiting for a pullback to previous support. I ignored the hammer candle on the basis that volume was lower than that of the previous bear candle. CHART 2 shows where this trade was stopped out at -16. Any thoughts on entries exits re: this trade are most welcome. My own analysis would point to the hammer that had formed with volume slightly above that of previous bear candle.
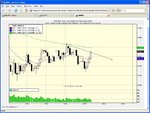
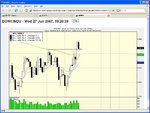
CHART 3 shows the second trade of the day and the entry position. This was based upon waiting patiently (too patiently) for the price to breach the days high and then waiting for a pull back to that high. CHART 4 shows where I manually exited the trade. The only explanation I can offer for exiting at this point is losing patience with the position. This is an unacceptable way to exit a position especially as in this instance, volume was increasing in the direction of the trend. As I write, the Dow has gone on to higher highs. Out for +36. Total for the evening +22.
Good points: sticking to stop losses and reversing the view of market direction.
Bad ponits: Losing patience (wanting excitement/gambling), having too much patience (fear) and ignoring volume (forgetfulness/laziness)
I hope this provides some meaning to people.
Tafita
Some excellent opprtunities again today on the Dow. The first of two trades today saw a short entry as per CHART1. (All charts are 5 minutes). The price had breached support on increased volume and it was just a case of waiting for a pullback to previous support. I ignored the hammer candle on the basis that volume was lower than that of the previous bear candle. CHART 2 shows where this trade was stopped out at -16. Any thoughts on entries exits re: this trade are most welcome. My own analysis would point to the hammer that had formed with volume slightly above that of previous bear candle.
CHART 3 shows the second trade of the day and the entry position. This was based upon waiting patiently (too patiently) for the price to breach the days high and then waiting for a pull back to that high. CHART 4 shows where I manually exited the trade. The only explanation I can offer for exiting at this point is losing patience with the position. This is an unacceptable way to exit a position especially as in this instance, volume was increasing in the direction of the trend. As I write, the Dow has gone on to higher highs. Out for +36. Total for the evening +22.
Good points: sticking to stop losses and reversing the view of market direction.
Bad ponits: Losing patience (wanting excitement/gambling), having too much patience (fear) and ignoring volume (forgetfulness/laziness)
I hope this provides some meaning to people.
Tafita
Attachments
Short Sep Dow 13528 stop 50 points,target 13375
Short Sept 523 - stop 25
Target - 'somewhere' a lot lower
firewalker99
Legendary member
- Messages
- 6,655
- Likes
- 613
Good evening
Some excellent opprtunities again today on the Dow. The first of two trades today saw a short entry as per CHART1. (All charts are 5 minutes). The price had breached support on increased volume and it was just a case of waiting for a pullback to previous support. I ignored the hammer candle on the basis that volume was lower than that of the previous bear candle. CHART 2 shows where this trade was stopped out at -16. Any thoughts on entries exits re: this trade are most welcome. My own analysis would point to the hammer that had formed with volume slightly above that of previous bear candle.
CHART 3 shows the second trade of the day and the entry position. This was based upon waiting patiently (too patiently) for the price to breach the days high and then waiting for a pull back to that high. CHART 4 shows where I manually exited the trade. The only explanation I can offer for exiting at this point is losing patience with the position. This is an unacceptable way to exit a position especially as in this instance, volume was increasing in the direction of the trend. As I write, the Dow has gone on to higher highs. Out for +36. Total for the evening +22.
Good points: sticking to stop losses and reversing the view of market direction.
Bad ponits: Losing patience (wanting excitement/gambling), having too much patience (fear) and ignoring volume (forgetfulness/laziness)
I hope this provides some meaning to people.
Tafita
Tafita, you have posted excellent charts and trades, but I think it would be more exciting if you can post those same trades live on the thread. That way other people (and myself) can benefit of your clearly good market calls and insight. Nothing is obliged, everything allowed 🙂
Although a lot of people are anticipating a relatively big correction on US indices am not sure. It already made the 25% fibo retracement (from low of march 14 and high of june 1st) on 7th june. that level on dow was 13250
then on 8th june it kind of formed a piercing pattern, followed by a bullish engulfing on 13th June (following another bounce from 13250). again yesterday it went down to 13250 and closed the day forming a hammer (not a classic hammer as the real body is big but still the same bullish implications). so the 25% fibo level of 13250 has been tested successfully 3 times
I wouldnt be surprised if we went on from here as it has already made a correction (25% fibo) and is forming bullishg candlestcik formations from this fibo level.
Although the ADX/DMI is slightly negative on the daily chart, the weekly is still showing a bullisg bias.
Pat494
Legendary member
- Messages
- 14,614
- Likes
- 1,588
Good evening
Some excellent opprtunities again today on the Dow. The first of two trades today saw a short entry as per CHART1. (All charts are 5 minutes). The price had breached support on increased volume and it was just a case of waiting for a pullback to previous support. I ignored the hammer candle on the basis that volume was lower than that of the previous bear candle. CHART 2 shows where this trade was stopped out at -16. Any thoughts on entries exits re: this trade are most welcome. My own analysis would point to the hammer that had formed with volume slightly above that of previous bear candle.
CHART 3 shows the second trade of the day and the entry position. This was based upon waiting patiently (too patiently) for the price to breach the days high and then waiting for a pull back to that high. CHART 4 shows where I manually exited the trade. The only explanation I can offer for exiting at this point is losing patience with the position. This is an unacceptable way to exit a position especially as in this instance, volume was increasing in the direction of the trend. As I write, the Dow has gone on to higher highs. Out for +36. Total for the evening +22.
Good points: sticking to stop losses and reversing the view of market direction.
Bad ponits: Losing patience (wanting excitement/gambling), having too much patience (fear) and ignoring volume (forgetfulness/laziness)
I hope this provides some meaning to people.
Tafita
Hi
Nice clear charts. ( My 2p worth )
Looking at chart 1 - on hindsight it would have been a good idea to connect the highs to get a perfect trendline up even though the price was oscillating. If you had had that in mind I expect you would have been in and out a number of times and each one for a bagful of points ?
lurkerlurker
Senior member
- Messages
- 2,482
- Likes
- 150
I'm quite annoyed - a bad day so far.
I shorted the numbers at 13:30, and had an open profit of almost 20 pips, then I covered at a high for +1 net of spread. Annoying indeed. Then the price fell again.
I made a short before the open (breaking my own rules - I don't trade before the open except on news) and lost -8 including spread. Net -7
I then missed that triple top short where both RSI div, Tick div, and strong resistance on the charts lined up to produce a rare signal of excellent clarity. I should have been able to take +20 net of spread from that, but I was busy messing about with my new E*Trade account. (on that point, I made a typo of my name as it appears on the card when trying to make a debit card deposit. I remove the card, and try to add it again with the correct details - but it doesn't let me - says the card number is already in use. Silly E*Trade. At least I have more than one debit card - I just used one of my other accounts - but still, a hassle. I'd have had to call them had I not had another card handy.)
So, 2 trades. 1 win (a crappy one because I got a bad cover on a short, near the high, +1), and 1 loss (executed immediately when I percieved it existed, but I shouldn't have been in the market anyway). 1 missed trade due to fiddling.
Who has a position, or a trading record so far?
Similar threads
- Replies
- 0
- Views
- 2K