You are using an out of date browser. It may not display this or other websites correctly.
You should upgrade or use an alternative browser.
You should upgrade or use an alternative browser.
millsy500 said:The dow looks like its flagging now on EOD after breaking out of its diamond. looking extremely bullish to me!!
Millsy
You're kidding aren't you?
Think im going to keep it for a while, bad things seem to be happening to the US, but confidence in the stock market seems really high still for some reason, which is a conumdrum when the wheels are coming off the Real Estate bandwagon and were seeing high P/Es of around 19. when the risk free rate will be 5.0% and maybe higher, who will buy equities earning 5% of risky profits ? and paying 2-3% dividends ? I dont see much upside. maybe ill be stopped but I think I may be able to keep it.
Racer
Senior member
- Messages
- 2,666
- Likes
- 30
"I think the economic outlook is reasonably positive," said Stern, president of the Minneapolis Fed
http://www.marketwatch.com/News/Sto...76E-4262-9444-3D85F0B5724E}&siteid=mktw&dist=
http://www.marketwatch.com/News/Sto...76E-4262-9444-3D85F0B5724E}&siteid=mktw&dist=
yeah exaclty, I don't give a lot of creedence he's a member of the Fed so he has his own agenda in terms of supporting the Bernanke line on the economy. e.g its strong we can raise rates, but that is Bernakes sacrifice hees trying to head off inflation now so he has some amunition to use when the recession hits. e.g if he had left rates at 1% in 2005 we would sill be awash in infaltion and the fed would be impotent when the house boom pop's
planet Fed quote of the day:
"I just don't think you can pick a handful of commodities ... and reach a conclusion about inflation,"
evidently doesn't share Greenspans views on gold and what it says about inflation.
anyway enough economics, trade what you see not what you think and all that 😉
planet Fed quote of the day:
"I just don't think you can pick a handful of commodities ... and reach a conclusion about inflation,"
evidently doesn't share Greenspans views on gold and what it says about inflation.
anyway enough economics, trade what you see not what you think and all that 😉
Racer
Senior member
- Messages
- 2,666
- Likes
- 30
"a recent Federal Reserve study of international experience documented the pro-cyclicality of real house prices: House prices have tended to reach a maximum near business cycle peaks, with real GDP growth slowing during the first year or so after house prices peak."
http://www.federalreserve.gov/boarddocs/speeches/2006/20060303/default.htm
http://www.federalreserve.gov/boarddocs/speeches/2006/20060303/default.htm
mombasa said:You're kidding aren't you?
don't think so. whats ur thoughts dude??
Millsy
millsy500 said:don't think so. whats ur thoughts dude??
Millsy
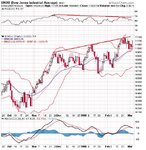
On a TA basis only, the divergence (RSI/MACD) on the dialyand weekly charts indicate that we are still in the process of a correction down to 10,600 at the very least.
bansir
Well-known member
- Messages
- 494
- Likes
- 42
divergence
hi mombasa,
I see a divergence as you suggest but it looks to be spread over several months on the daily chart. Could it therefore be a weak indication?
Or have I just got the chart settings wrong and you're seeing something more pronounced?
Or maybe you're looking at the futures chart?
mombasa said:On a TA basis only, the divergence (RSI/MACD) on the dialyand weekly charts indicate that we are still in the process of a correction down to 10,600 at the very least.
hi mombasa,
I see a divergence as you suggest but it looks to be spread over several months on the daily chart. Could it therefore be a weak indication?
Or have I just got the chart settings wrong and you're seeing something more pronounced?
Or maybe you're looking at the futures chart?
Attachments
bansir said:hi mombasa,
I see a divergence as you suggest but it looks to be spread over several months on the daily chart. Could it therefore be a weak indication?
Or have I just got the chart settings wrong and you're seeing something more pronounced?
Or maybe you're looking at the futures chart?
That's my point - long term divergence means a big move in price.
bansir
Well-known member
- Messages
- 494
- Likes
- 42
mombasa said:That's my point - long term divergence means a big move in price.
fair enough Mombasa.
It's just that day trading using 5min charts i've found that when the divergent tops are spaced more than 30 or 50 mins apart they generally don't yield a reversal and tend to give in to a trend for the day. Guess it's different for the daily/weekly picture.
Time will tell 🙂
BTW P&F daily shows support @ 10850 ish.
Cheers,
Neil
leovirgo said:Divergences are meaningless unless they are confirmed by price action in the anticipated direction. In this case, adding more to the position whenever price moved in desired direction would have resulted in decent profits IMO.
In this case, the diveregence was confirmed by hammer candle on 5 min chart, plus the support on the bottom channel line.
Similar threads
- Replies
- 3
- Views
- 2K