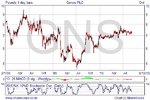
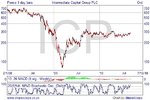
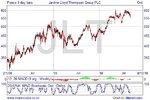
Don't Panic!!

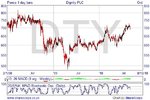
On quick inspection there seems nothing obvious that would cause these to consistently lose with your strategies. They are not particularly 'spikey'. Nor is there any price action that stands out from any other shares. You are right however about the low volumes. Anyway I'll post the charts up and see of anyone else can spot anything. What was your other share that went bust? Connaught?

Sam.
 

Attachments

  • DTY.jpg
    DTY.jpg
    49.9 KB · Views: 198
  • GNS.jpg
    GNS.jpg
    49.5 KB · Views: 166
  • ICP.jpg
    ICP.jpg
    45.8 KB · Views: 195
  • JLT.jpg
    JLT.jpg
    47.7 KB · Views: 160
All four look to have reasonable trends from the beginning of July so I suspect this is just "stops" too close. Which comes back to your strategy on timeframe, entry/exit, etc.. If you were to look at a 1-2 month timeframe trending strategy with say a 2 ATR trailing stop, all of these would be in profit...
 
ah read timescales wrong, take that back!
Dignity and JLT do look reasonable though!
 
Apologies for the radio silence, and thank you Sam and Leonarda. I've been head-down ploughing through the spreadsheets with three particular points of focus:

1. Bringing everything up to date after nearly three weeks of bare bones maintenance - job done.

2. Keeping my eyes open for correlation between the dodgy four stocks, including scrutinising Sam's charts, and seeing what I could see from Yahoo's data - I've found something very interesting, which I'll expand on in a moment.

3. Adding a 10th method, which occurred to me on a whim while I was updating the spreadsheet with the overdue maintenance - very exciting results, I'll expand on this first.

10th Time Lucky

Oh wow! Something here to write home about. The figures are not huge, because Method 10 is using an entry that doesn't have me entering a lot of trades, and does tend to pull me out a bit fast too. I've applied it across the basket of 11 shares (including the suspended one, which was Connaught), over the same time period as the other methods and it shows a profit over 6 of the basket totaling £1,073.33 and a loss over 4 of the basket of £309.15. Overall it has a profit of £764.18.

Okay, the figures are not astounding in themselves, but what I get from this method is great consistency. If something's going to make a profit, the method might or might not let it run, but if it's going to make a loss, the likelihood is high that Method 10 will pull out before it gets anywhere near a stop. It's very safe, and I like that. It's also very simple.

I added a column to each of the methods for each of the shares, which showed how much profit / loss I was "running" on any one day, just so I could see what potential I was missing, and how high my risks were running, between trading actions. It was a little annoying seeing nice profits running in the £100s turn to small profits in the £10s before my various money management techniques pulled the cash out. "Wouldn't it be great if I could model a trailing stop". Not easy, but I figured I could fashion a crude version by adding an exit trigger that was calculated to activate when the buy/sell (including spread) caused my profit to drop to 2/3rds of it's maximum since entry.

A big benefit of this method is that if it's not making money, if the price is going sideways, a spike will tend to take it out rather than leaving it to run and cost rollover fees.

Method 10 is an exit strategy, it doesn't dictate entry at all, I've applied it to one of the entry methods which uses indicators to dictate entry. Compared to the other exit strategies, Method 10 is so successful at making me feel comfortable, that next time I'm restructuring the spreadsheet I'm going to bin off the other exit strategies - this is the one I'm going to use in my trading plan.

What I've seen in the 'Dodgy Four'

I was looking at Sam's charts, and looking at Yahoo's charts, and idly playing with iPhone app charting thingies just for the fun of it while I was bored. I spotted something, I had one of those "so obvious I couldn't see it" moments of clarity. I developed a hypothesis and then tested it out across the basket of shares and found a correlation.

When I set Yahoo's candlestick chart to a timeframe of 1 month, I can easily count the number of times that the colour sequence changes from red to green and back to red again. All of the shares that I've been mostly making profit on have changed colour 8 times or less in a month, all of the shares that I've been making a loss on have changed colour 8 times or more in a month.

It's obvious really, my methods attempt to ride a trend, so shares that flip between up and down on long cycles are easier to identify, get on board, and ride for a while before I exit with cash. Shares that flip between up and down on rapid cycles don't give me time to identify them and get on board before they're heading in the wrong direction for me again.

Okay, so I figure that the market isn't rational, so I could identify a stock that's had a slow flip cycle (I'm sure there's a proper name for that) for the last month, but it's no guarantee that it'd continue that way for another month. But I only need it to continue that way for three days. I need three days of a continued trend to identify it, get on board and ride it to beyond breakeven. Could it be that I should browse the 1 month charts to identify suitable candidates and bin off the old basket of shares?

I know now that for my current methods a "suitable candidate" is a stock with a price of between 200p and 400p and with a volatility (measured using my own quirky version of an ATR(14)) between 5 and 15, preferably as consistent as possible. (Volatile is good, so long as it's consistently volatile, quiet days and noisy days screw the calculations.)

Hypothesis of the (14)s

Just a thought. I use 14 day averages a lot in my calculations, from stops to entry indicators, to the now-defunct exit strategies. Maybe 14 day averages work great with stocks that don't flip their price cycle more often than every four days on average (8 flips a month), but maybe a shorter averaging period would work better for the stocks that flip more frequently? Maybe before I bin off the old basket of 11 I should have a look at what happens if I replace the arbitrary 14 day averages with a 7 day average - or even a 3 day, just to see what happens.

Summary

Anyway, enough for tonight. I'm very happy to have identified something that'll form part of my trade plan, something I can believe in enough that I won't try and second guess it when I'm playing for real. I'm pleased that I'm on the trail of some more ideas that I want to check out too.

I should be a bit more active in here now that I'm on top of things again. :D

Sal
 
It's obvious really, my methods attempt to ride a trend, so shares that flip between up and down on long cycles are easier to identify, get on board, and ride for a while before I exit with cash. Shares that flip between up and down on rapid cycles don't give me time to identify them and get on board before they're heading in the wrong direction for me again.

You need to be careful you're not fitting a strategy to previous performance, these 4 in this case, always think about the actual reasoning rather than only the data itself. Although, I think you are doing that in this case.

What it sounds like you're after here is using something like an ADX filter maybe with a period of 14 or so depending on your timeframe to get the sort of trending stocks you want. eg.ADX(14) > 30
 
Well, after giving it some thought and playing around with my spreadsheets a little more I've decided to stop experimenting with the basket of 10/11. With what I've learned now, I know I wouldn't think of betting on a good few of these, and it takes time to consistently apply hypotheses across them all. It's time to bin off most of the old basket and try looking for a few new candidates.

The original basket of 10 were chosen according to the following criteria (in order of importance):
1. FTSE 250
2. At or near the front of the alphabet
3. I didn't recognise their name (so not influenced by fundamentals)
4. Short name
5. Decent variation of prices across the basket

Here's what I got:
Afren, Beazley, CSR, Dignity, EAGA, Fenner, Genus, Helical Bar (chosen for daft name / comedy effect), ICG and Jar LLoyd.

The 11th share was added later because I wanted to know how spreadbetting behaves with very low price stocks. I looked for a low price stock up the front end of the alphabet and got Connaught (lol).

I haven't chosen my new basket yet, I'm starting that tonight, with the aim of being all set up by tomorrow night in time for Monday trading. My new criteria is:
1. FTSE 250 (keeping that consistant for the moment)
2. At or near the front of the alphabet
3. Price between 200p and 400p
4. Volatility using my version of an ATR(14) of between 5 and 20, but smooth, not spiky
5. Price flip on a 1 month Yahoo candlestick chart of 8 maximum as at eod Friday.

Choosing the new basket to satisfy 1 to 3 above will be easy enough, but 4 and 5 will take a bit of maths and research. I'm just gonna start at A and work my way through the alphabet until I've found maybe 8 stocks to use in a new basket. Any that fulfill the criteria from the old basket will be automatically included, no point in wasting good historical data.

Okay, here goes, I shall share what comes out of this stock-choice exercise.

Sal
 
Okay, yes, I've found something interesting about risk management and spreadbetting.

The mechanics of spreadbetting with a guaranteed stop mean that the lower the share price, the lower your risk.

e.g. for a £5,000 account size: 30p shares carry a minimum risk of 0.4%, £1 shares carry a minimum risk of 0.95%, £3 shares are 2.6%, £4.50 are 3.8%. Going all the way up to £16 shares, (with only a £1 minimum bet), the minimum risk is 13.9%. (Obviously, you could always choose to increase your risk by betting more money or increasing your stop price gap, and you can reduce it by increasing your account size.)

Now, that's a bit counter-intuitive to me, I'm used to low price shares carrying a greater risk. When I buy shares (that makes me an equity trader, right?), I'm investing a lump sum, say £5,000, which can buy me 500 shares at £10 a pop or 50,000 shares at 10p. Without anything remarkable happening to the company or the market, it's a lot easier to lose money (or make it) with the lower price share than the higher price share. A 0.01p move on a £10 share is negligible, but on a 10p share is significant. The larger volatility means that the increased risk is matched by an increase in potential reward, and the higher number of shares purchased amplifies the effect.

It works the opposite way with spreadbetting :!:

There is a minimum bet, which is £s per 0.01p of movement. I'm sure there's variation in the market, I'm just looking at IG Index at the moment, so I'll stick with the example of a minimum £5 bet per 0.01p of movement for lower priced shares.

£5 x the total change in share price = % x profit/loss

There is nothing taking account of the proportion of the original price - a 0.01p change is equally costly or rewarding for a £10 share as for a 10p share. As the £10 share is more likely than the 10p to a price movement of, say 5p, it makes the £10 share behave as though it was the more volatile. Consequently, a high price share which is range bound and just meandering a little along a flat price will have all kinds of spikes in the SB profit / loss. Conversely, the 10p share can be experiencing step changes in price and hardly register.

There's a killer blow in all of this though. A guaranteed stop has to be set at a minimum price gap, lets use the example 7.5%. 7.5% of a high value share is an awful lot more 0.01p point movements than 7.5% of a lower share, and you're losing a fixed £5 per 0.01p fall. In other words, a 7.5% price fall triggering a stop on a high value share will cost significantly more than a 7.5% price fall on a low value share - even though the minimum bet size is the same (within a range).

It all seems a bit bizarre, and maybe I've got something wrong. I've chosen an 11th stock to track, to test out the formulae in my model, it's been trading below the 30p for some time, so it shows up on my model as a tiny risk. I'm curious what'll happen next.

Square-eyed Sal

Charges/Spread will be much higher on the higher priced more volatile share.
 
Looking good, just finished back-tested a basket of shares chosen using the new criteria and got profits in excess of £1000 for the month using a refinement of the method described earlier. I've set it up to paper trade (as best as I can without an SB account), and acted on all of the signals exactly as instructed by the spreadsheets. It's only 4 days in, but the bet values are running at £100 profit. Not bad considering it usually takes a week or two to get an entry signal on the whole basket, and it takes a day or so to recover the spread. (y)

Anyway, I'm satisfied that I've got a set of rules to trade with, so I'm currently writing up my trading plan using Tim's template. Keeping the spreadsheet up to date is the easy bit, but now I need to get written down how that translates into what-I-do-and-when, before I forget how to apply all these rules. Kinda simple during trading, quite complex out-of-hours.

The shares in the basket are:
AQP.L, BVS.L, LAM.L (new shares in the basket)
CSR.L, FENR.L and HLCL.L (star performers from the last trial).

I'm also running a parallel trial on EZJ.L, IMG.L and INCH.L. I believe that these three would make me a loss if I was to paper trade them with my method, but it would be useful to see if that's true.

I hoped to be at this point by October, got here a little earlier :cheesy:

Sal
 
Sounds like you are doing very well. I'm jealous of your superior brain power! What was your starting (paper) capital?

Sam
 
Lol Sam, you flatter me. It's nothing to do with brain power, it's just that I've got experience in the application of hard-core maths. People with far greater brain power than I have developed techniques to analyse data environments as illogical and complex as the markets, I'm just pinching a few of their tools and applying them in a way I've been taught how.

So here's some stats for you, and a question I'm throwing out there.

In spreadbetting terms, I'm not sure how to define starting capital for a leveraged product.

On average, each trade would require a deposit of about £200, so to trade the 6 securities I'd need an account balance of £1,200, assuming that all 6 would have simultaneous open positions at some point.

The maximum stop loss value that any of the trades can hit is £250, so an account balance which is certain to cover all normal stop losses (assuming that all 6 securities were in open positions at once and stopped out at once) I'd need an account balance of £1,500.

In the event that the basket of 6 were all suspended at the same time and I was charged the full amount of the investment then I'd need an account balance of approximately £21,000.

I'm not sure what the protocol is, how to define my starting capital. For my own purposes I'm planning on keeping a balance on account that covers the potential of all trades being stopped out at the same time, so £1,500. That's got quite a lot of margin in it as I assume 5% slippage, and the £250 maximum loss is rare, the average loss is closer to £100.

In the month of back testing the method gave me 14 entry signals that were closed out before the end of the test month. Of these 14, 8 resulted in successful trades. A success ratio of 57% is hardly something to get excited about, but my average profit was £227.10 per successful trade, and the average loss was £100.58 per losing trade. The average result of all closed trades was +£86.66. I can afford my success ratio to drop as low as 30% and still breakeven if that profit to loss average stays as it is.

Now, I need a little help here. I want to define a performance indicator that I can use to measure whether the average result is getting better or worse as I adjust things that I think will improve my success ratio. I thought maybe a Sharpe ratio would do the trick, but I'm not sure how to calculate it. Wikipedia didn't help, even though it has the formula, as it doesn't give a good definition for the variables.

What I'm trying to achieve is this: I'll be adjusting my entry criteria to see if I can improve the 57% success ratio. If I achieve a 75% success ratio, but it makes my average loss bigger than my average profit, then the method has become less successful rather than more successful. I can make up an indicator of my own to monitor this, but if somebody has already invented one, I may as well use the industry standard tool.

So, the Sharpe ratio. I know lots of people spit feathers at the thought of it telling you something useful, but it looks like a tool that will fit this particular job. The wikipedia version of a Sharpe ratio includes a variable for an alternative risk-free return, as I'm short-term swing trading small values, I'm taking this variable to be negligible.

Tim's trade plan template says that I can calculate the Sharpe ratio by: "divide the average £££'s gained on profitable trades [£227.10] by the combined figure of the average number of £££'s gained and lost [? is this £86.66, the average return over all 14 trades, or £126.52, the combined total of £227.10 the average profit and -£100.58 the average loss?] and then multiply by 100". Using this method my Sharpe ratio is either 2.6:1 or 1.8:1. I suppose it doesn't really matter, so long as I apply the calculation consistently. I want it moving as close to 1:1 as possible don't I? That would be the result if every trade was a profitable trade. Hmm, what I've read suggests that a higher ratio is a better ratio, so something's not right here.

Suggestions would be appreciated, I'm quite happy to look at alternatives to the Sharpe ratio that tell me whether or not my tinkering is working. Meanwhile, I'm a week into paper trading the details of my trading plan while I'm writing it.

Cheers,

Sal
[FONT=&quot]Good to see the progress you are making. I also faced the problem of assessing the quality of my trades. I looked at the Sharpe ratio but decided it was overkill for my needs - and as Wiki suggests, it has some data distribution limitations anyway. I use the very simple method outlined by Van Tharpe - divide profit by risk to produce an "R" ratio. (Is Sharpe another manifestation of what I call “the washing machine syndrome” where you have 30 programmes for every conceivable situation but use at most 2/3?)[/FONT]

[FONT=&quot]Thus you can get "R" for each trade, a particular series/selection or all. I feed this into spreadsheet, produce a smoothed graph and can see where I'm going. Like you, I change technique parameters from time to time, and again the spreadsheet can reflect the results. I found when starting out that my natural inclination was to concentrate on success ratio (“[/FONT]What I'm trying to achieve is this: I'll be adjusting my entry criteria to see if I can improve the 57% success ratio.”) – it is satisfying to do this but what’s more important is overall profit – I believe there are people who are very profitable but only have a few winning trades. However, a system that has high win ratio and is very profitable is ideal for me from a psychological point of view.

[FONT=&quot]You have to be careful if you assess your system with "R" - it can be indicative but beware the falsity of a sequence of trades that produce a high average multiple (good) used in a system that generates only a few trades (potentially not a way to get rich quickly). The converse can also be true where a low multiple from many trades makes an overall very profitable system (scalping an extreme example?).[/FONT]

[FONT=&quot]The other thing this will not necessarily tell you is whether your system is any good in other markets/timeframes/periods. That's another reason (IMHO) to adopted a generic system designed to be as independent of these variables as possible - or at least know what your system's limitations are. Again, any change in performance (for whatever reason) is soon apparent in the SS. (Thank you, O Lord, for the accountant that invented the VisiCalc pioneering spreadsheet). [/FONT]Like you I also monitor quality of entry and, as mentioned before, I do this using MAE (max adverse excursion) – but this is to a certain extent, icing on the cake and decreases in importance as the trade length increases.

Keep up the good work & let us know the progress.
 
Last edited:
Cool, thanks 0007, I'll have a go at calculating the R ratio and see what it tells me. It sounds like a nice, simple tool to achieve what I'm after achieving.

Of course, the ultimate performance indicator is my account balance, but that's a bit of a blunt instrument to tell me which bits of my strategy are working and which bits aren't.

Thanks for the encouragement, the reassurance over the 57%, and the advice - I extend that thanks to everybody who's chipped in. (y)

Sal
 
Sal,
Just noticed your avatar. Reminds me: "when you're up to your ass in alligators, it's difficult to remember that the original intention was to drain the swamp!"
 
Lol Sam, you flatter me. It's nothing to do with brain power, it's just that I've got experience in the application of hard-core maths. People with far greater brain power than I have developed techniques to analyse data environments as illogical and complex as the markets, I'm just pinching a few of their tools and applying them in a way I've been taught how.

I think you are very modest Sal! It must have something to do with brain power because I don't get most of it! I don't know how you'd determine starting capital - I determined mine by how much money I have in the bank! Lol. Oh and be careful with the purple writing! It might raise some eyebrows!!!

Sam.
 
Purple can be controversial, huh? Thanks for the warning, I shall bear that in mind, lol.

So... I'm loving the R ratio as a way to compare the performance of methods, and the performance of different shares in the basket. It's helped to spread a little more light on what's performing well / badly.

I tinkered a bit more to see if I could optimise my method, but the small adjustments were probably an order smaller than the difference between Yahoo prices and spreadbetting prices. Basically, the biggest problem with my methodology had become the assumptions I was making about SB pricing.

I opened an account with IG Index and I've spent the last week replacing Yahoo data on my paper trades and back-testing with historical IG prices. There was a significant difference in prices at the individual trade level, sometimes in my favour, sometimes against. Yahoo data is a bit more spiky, making my ATRs a bit wider.

I hadn't planned on being ready to open an account until January, but I've got a good method, the trade plan is written and I'm confident with it, so there didn't seem to be much point hanging around. My plan dictates that I will back-test a share for two months, then if it's showing signs of profitability I'll paper trade it for a month before moving it into live trading.

There's three shares that are old enough in my current paper trading basket that I've back-tested for 2 months and paper-traded forward for another month and are still showing excellent performance, so I decided that I'd use those three to try out the IG platform while IG are letting me place bets at 10p a shot. The minimum price for the shares I trade are usually £5 a bet, so it's nice to have a practice with a low value while I make sure I'm ticking the right boxes and pressing the right buttons.

Just because I'm playing with pennies, doesn't mean that I can step outside of the plan though, so I've had a few days of testing my discipline, waiting for one of the three to give me an entry signal. I finally got a signal EOD Friday. Go long on HLCL.L.

Looking at the charts, I'm not sure that this is a particularly well-timed entry. My limit would require that the price reaches something like a 6 month high, while Helical Bar seems to be on a downward slide. Oh well, I've gotta do what the plan says or I'll never reap the benefits.

The plan says "Go long on Helical Bar on Monday." It doesn't say what time on Monday. I've got two windows to trade in, there's the first hour after open before I go to work, and there's a random time between 12pm and 2.30-ish when I'll take my lunch.

I checked out Helical Bar's charts for previous days when I've had a buy signal, and typically it's better to buy at open than at middle-day, so I went in just before 8.30am this morning and caught the price near the top of a spike. Doh! The low was during the middle of the day. It was very tempting to tick-watch, but I had work to do (day-job stuff), so had to turn it off. The price must have recovered over the day, as I see my trade is showing a loss of -£0.08, which is less than the opening spread I think.

Lol, it's exciting. I'm glad I've got a plan I'm working to, it kinda takes away the weight of responsibility. I'm just doing what I'm told.

Sal
 
Good work Sal. The comment about the purple text was referring to a very prolific former member here that went by the name of SOCRATES. Some people thought he was a genius, some thought he was mad. He certainly divided people. He wrote many of his posts in purple and now if anyone writes in purple it raises a few eyebrows!

http://www.trade2win.com/boards/members/12621-socrates.html

Anyway, you seem to have made good progress here. How did you go about finding a strategy that works? I've been searching for years and not found anything!

Also, what are your thoughts on automation? If you download MetaTrader and get someone to program you an EA based on your strategy, you can then back test it on shares/commodities/forex etc... Over like 10 years or so of data. It will give you results and hypothetical equity graph. If it works you can then set the EA to trade automatically...

Sam.
 
So, the Sharpe ratio. I know lots of people spit feathers at the thought of it telling you something useful, but it looks like a tool that will fit this particular job. The wikipedia version of a Sharpe ratio includes a variable for an alternative risk-free return, as I'm short-term swing trading small values, I'm taking this variable to be negligible.

Risk-free return would be if you put it in a bank account and earned interest.
 
Sal,
Just noticed your avatar. Reminds me: "when you're up to your ass in alligators, it's difficult to remember that the original intention was to drain the swamp!"

Well, I've pulled the plug out of the swamp now - no going back! Bring on the gators!
 
Good work Sal. The comment about the purple text was referring to a very prolific former member here that went by the name of SOCRATES. Some people thought he was a genius, some thought he was mad. He certainly divided people. He wrote many of his posts in purple and now if anyone writes in purple it raises a few eyebrows!

http://www.trade2win.com/boards/members/12621-socrates.html

Anyway, you seem to have made good progress here. How did you go about finding a strategy that works? I've been searching for years and not found anything!

Also, what are your thoughts on automation? If you download MetaTrader and get someone to program you an EA based on your strategy, you can then back test it on shares/commodities/forex etc... Over like 10 years or so of data. It will give you results and hypothetical equity graph. If it works you can then set the EA to trade automatically...

Sam.

Purple text: Ahh, now it makes sense.

Strategy that works: I'm not counting my chickens yet, it only works in theory, and I may have made all kinds of errors in my assumptions or calculations. I've spotted a biggie already, the spreads that IG give me are massive compared to my assumed spreads. I've re-estimated the historical spreads that I've built into my data and projected it forward on a couple of shares in the basket. It makes a massive difference to the trades, but oddly seems to be slightly more profitable over a 2 to 3 month period. Gives a better R ratio too. Time shall tell, I suspect I've got some sums wrong.

Automation: I don't have any issues with automation, so long as there is regular dip-testing to ensure that the automated strategy is still valid. My methodology could almost by automated - it's definitely specified by boolean rules - with the exception of 'candidate' share selection and the random point/time of entry. Both of these two elements of my strategy need further work before I could mechanise them. I'm interested in attempting to automate back-testing, it's quite tedious manually manipulating the spreadsheets for two months just to prove that a candidate share is a reject. It's something I hope to put some time into, maybe before Christmas.
 
Top