Cable Sal
Member
- Messages
- 70
- Likes
- 7
I haven't had chance to trial the stochastics over the weekend, I was hoping to do it today but aaargh, crisis, no broadband!
I can cope without broadband for trading, I have the iPhone app and telephone trading set up, but for analysis purposes, I can't do without broadband.
I tried my local wifi spot, they were down too. It seemed like a good excuse to trial my emergency contingency plan and decamp to a hotel (a little treat I give myself from time to time anyway), but my usual 2nd-home-in-the-city was suffering from the same problem. Seems like a biggie for BT then. I ended up in a rather nice city centre 4 star not too far from the office for tomorrow morning. Quite a distraction.
Anyway, back to the results of the weekend's work. I broke the rules of my trading plan last week by taking the duel AQP trades. The penalty for one breach is to amend my trading plan to cover the circumstance that caused the breach, so I did that yesterday. It was beginning to look a little old anyway, as it pre-dated my first trade (last Monday).
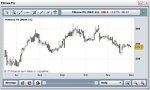
I got down to a bit of analysis work also (before the broadband crisis). I'm binning off Bovis (BVS), it's going nowhere in paper-trading, and extending the back-testing backwards a couple of extra months throws it into a loss. It's not looking like a compatible share for my method.
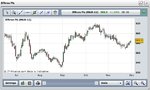
However, Ashmore (ASHM) is looking like a potential star. The two month backtest showed promise, I extended it to four months and it just kept on adding profit to pot. It's been in paper-trading since 30th September, which is only long enough for one trade to be initiated, but it's looking good. I think we might have a new star for the live basket by the end of October.
My trading plan at the moment requires a minimum back-test of 2 months and forward paper-trade of 1 month, this is because I haven't been able to identify yet exactly what it is that makes some shares compatible and some not. I think over time I'll find that compatibility isn't lasting, it's momentary. Part of my routine is to keep an eye on live shares losing their compatibility, in which case I would put them back into paper-trading until I decide to bin them off or reinstate them.
I'm contemplating increasing the minimum back-test period from 2 months to 4 months as it's not a great deal more effort (the effort is a one off jobbie per share), and it seems to reinforce the results. I tried extending the back-testing on all of the shares in the current basket, and the ones doing well did even better, and the ones doing badly did even worse.
I wasn't sure of the relevance of extending the back-testing so far, as I'm looking to see if recent-past performance is likely to predict near-future compatibility, but it seems to work. I'm not sure why, whether there's something inherent in my method that means that some shares' price behaviour patterns will mostly work and others have patterns that mostly won't.
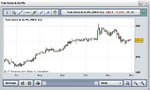
It's not obvious which shares will work and which won't, as Inchcape showed me. I looked at its chart and thought that it's just too choppy, my method wouldn't be able to pull a profit out often enough to pay for the losses - but it proved me wrong, Inchcape's choppiness is perfect. 4 months of backtesting and nearly 4 weeks of paper-trading have managed to ride the waves really well.
One day I'll get it fathomed how to spot the shares that are most likely to make a profit in back-testing, but for the moment I'll just suck 'em and see how they taste!
Wishing you all good trading,
Sal
I can cope without broadband for trading, I have the iPhone app and telephone trading set up, but for analysis purposes, I can't do without broadband.
I tried my local wifi spot, they were down too. It seemed like a good excuse to trial my emergency contingency plan and decamp to a hotel (a little treat I give myself from time to time anyway), but my usual 2nd-home-in-the-city was suffering from the same problem. Seems like a biggie for BT then. I ended up in a rather nice city centre 4 star not too far from the office for tomorrow morning. Quite a distraction.
Anyway, back to the results of the weekend's work. I broke the rules of my trading plan last week by taking the duel AQP trades. The penalty for one breach is to amend my trading plan to cover the circumstance that caused the breach, so I did that yesterday. It was beginning to look a little old anyway, as it pre-dated my first trade (last Monday).
I got down to a bit of analysis work also (before the broadband crisis). I'm binning off Bovis (BVS), it's going nowhere in paper-trading, and extending the back-testing backwards a couple of extra months throws it into a loss. It's not looking like a compatible share for my method.
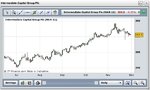
However, Ashmore (ASHM) is looking like a potential star. The two month backtest showed promise, I extended it to four months and it just kept on adding profit to pot. It's been in paper-trading since 30th September, which is only long enough for one trade to be initiated, but it's looking good. I think we might have a new star for the live basket by the end of October.
My trading plan at the moment requires a minimum back-test of 2 months and forward paper-trade of 1 month, this is because I haven't been able to identify yet exactly what it is that makes some shares compatible and some not. I think over time I'll find that compatibility isn't lasting, it's momentary. Part of my routine is to keep an eye on live shares losing their compatibility, in which case I would put them back into paper-trading until I decide to bin them off or reinstate them.
I'm contemplating increasing the minimum back-test period from 2 months to 4 months as it's not a great deal more effort (the effort is a one off jobbie per share), and it seems to reinforce the results. I tried extending the back-testing on all of the shares in the current basket, and the ones doing well did even better, and the ones doing badly did even worse.
I wasn't sure of the relevance of extending the back-testing so far, as I'm looking to see if recent-past performance is likely to predict near-future compatibility, but it seems to work. I'm not sure why, whether there's something inherent in my method that means that some shares' price behaviour patterns will mostly work and others have patterns that mostly won't.
It's not obvious which shares will work and which won't, as Inchcape showed me. I looked at its chart and thought that it's just too choppy, my method wouldn't be able to pull a profit out often enough to pay for the losses - but it proved me wrong, Inchcape's choppiness is perfect. 4 months of backtesting and nearly 4 weeks of paper-trading have managed to ride the waves really well.
One day I'll get it fathomed how to spot the shares that are most likely to make a profit in back-testing, but for the moment I'll just suck 'em and see how they taste!
Wishing you all good trading,
Sal