bbmac
Veteren member
- Messages
- 3,584
- Likes
- 789
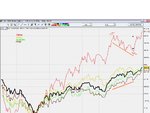
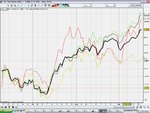
The pics below are the Weekly Dow chart 1928-32 and the index from the 2007 Hi to present day...look closely at the pattern marked by the letters a-g on each chart.
The question is, are we at point h again?,...and if not is point g the beginning of the W shaped recovery?


The question is, are we at point h again?,...and if not is point g the beginning of the W shaped recovery?