In the past I have been able to determine the potential trend moves using fibonacci clusters on medium to long-term charts. However, I seem to be struggling to identify the correct points where corrections usually tend to end with fibonacci clusters. In terms of corrections the fibonacci expansion tool which has been particularly useful in trends does not seem to provide much help with the 1.0 and 1.618 levels when combined with the retracement tool to create clusters of potential support or resistance zones. Could someone please suggest what a good way to identify strong support and resistance levels in a correction would be. I also tend to use volume for confirmation but would need to identify solid end of correction zones first I believe.
You are using an out of date browser. It may not display this or other websites correctly.
You should upgrade or use an alternative browser.
You should upgrade or use an alternative browser.
BuddieBuddiee
Active member
- Messages
- 179
- Likes
- 7
have you tried Danielcode ?
 www.thedanielcode.com
Danielcode Futures & Forex | Trading & Training
Do you know if it is free?have you tried Danielcode ?
Danielcode Futures & Forex | Trading & Training
Rufus_Leakey
Established member
- Messages
- 749
- Likes
- 537
One month delayed charts claim to be free.Do you know if it is free?
Just a bit of context.
The first thing one needs to make use of Depth of Market
is a quality data feed. Don't bother with anything else until you
have that in place. Now back to my original comment below
-------------------
I have pointed this out a couple of times previously
Reading order flow is fine IF you have the skills and can keep up
with fast market conditions. Few (if any) retail traders have the skills
or the talent. I have been doing this for many years and still find it
challenging to keep up and make good decisions. What makes it
easier to is to consolidate the data using CVD (once you learn how
to set it up to achieve the proper granularity for your target market)
Then it is a matter of watching the price action at specific points in time
and matching what you see to the volume coming onto your screen.
Nothing work perfectly of course. But in my opinion it is a easier and
more accessible way to trade (for amateurs).
I will attach a chart, but without the proper background it will probably not
make much sense at first. Reading up on the subject of Cumulative Volume
Delta might be a good idea. As I have mentioned I will be LiveStreaming my
own trading in the coming days on Twitch and YouTube. I don't plan to do
that for very long, so it might be a good idea to visit and take a look. It might
help you
Postscript
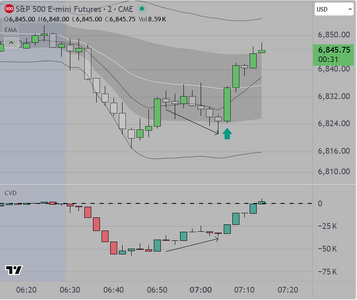
The chart shows the S&P 500 Futures Market (NY session). CVD at the bottom
setup to provide max granularity. Price action shows a breakout (B/O above a key
reference) The CVD updates at intervals that align with the B/O so (eventually) the
trader learns to see whether the breakout has legs or is stalling on low volume.
Learning to identify the components (price action & volume) accurately is what
is required for success.
PostScript
It was called to my attention that my CVD settings were incorrect.
I have removed that chart, replacing with a chart with corrected settings
I apologize for the inconvenience.
Good luck
The first thing one needs to make use of Depth of Market
is a quality data feed. Don't bother with anything else until you
have that in place. Now back to my original comment below
-------------------
I have pointed this out a couple of times previously
Reading order flow is fine IF you have the skills and can keep up
with fast market conditions. Few (if any) retail traders have the skills
or the talent. I have been doing this for many years and still find it
challenging to keep up and make good decisions. What makes it
easier to is to consolidate the data using CVD (once you learn how
to set it up to achieve the proper granularity for your target market)
Then it is a matter of watching the price action at specific points in time
and matching what you see to the volume coming onto your screen.
Nothing work perfectly of course. But in my opinion it is a easier and
more accessible way to trade (for amateurs).
I will attach a chart, but without the proper background it will probably not
make much sense at first. Reading up on the subject of Cumulative Volume
Delta might be a good idea. As I have mentioned I will be LiveStreaming my
own trading in the coming days on Twitch and YouTube. I don't plan to do
that for very long, so it might be a good idea to visit and take a look. It might
help you
Postscript
The chart shows the S&P 500 Futures Market (NY session). CVD at the bottom
setup to provide max granularity. Price action shows a breakout (B/O above a key
reference) The CVD updates at intervals that align with the B/O so (eventually) the
trader learns to see whether the breakout has legs or is stalling on low volume.
Learning to identify the components (price action & volume) accurately is what
is required for success.
PostScript
It was called to my attention that my CVD settings were incorrect.
I have removed that chart, replacing with a chart with corrected settings
I apologize for the inconvenience.
Good luck
Attachments

Last edited:
Hi Steven,
Where you went long, presumably off of the EMA, I would not have taken that trade based on the CVD. Price was going up while CVD was declining. Conflicting signals. A divergence. Bullish absorption if I am correct. Plus the CVD candles in the look back period where you took the trade were noticeably smaller than the immediate previous look back period. Indicating weakening. Based on the CVD I would have been looking for a pullback or reversal which obviously did not happen. Price moved up consistent with the close above the EMA. The look back period is also quite short with CVD resetting what appears to be every 6-9 candles or so. I am missing something here. I can't quite figure it out. Can you provide more of an explanation concerning your use of CVD.
Thanks
BuddieBuddiee
Active member
- Messages
- 179
- Likes
- 7
no I haven't. but I know someone who has tried it. not sure if successful. I replied to your post while I was looking at my archived stuff I saved over the years and thought I'd throw it out here.Do you know if it is free?
I've read and tried some Michael S. Jenkins stuff.
also there's GANN Murrey Math
https://www.yumpu.com/en/document/view/6222165/gann-articles
https://www.yumpu.com/en/document/read/6222165/gann-articles
right now am using the "7.8125" factor -- derived from 62.5 /8 and also the .272% - 1.854% and all the stuff you'd see where I've posted re SPX. hard to articulate.
I'm not at this site during trading hours...so that's why the late reply.
BuddieBuddiee
Active member
- Messages
- 179
- Likes
- 7
ha... nothing's free, apparently.One month delayed charts claim to be free.
View attachment 344441
The pullback you mentioned did not happen because one side gave up. You call it bullish absorption. Either way is fine.Hi Steven,
Where you went long, presumably off of the EMA, I would not have taken that trade based on the CVD. Price was going up while CVD was declining. Conflicting signals. A divergence. Bullish absorption if I am correct. Plus the CVD candles in the look back period where you took the trade were noticeably smaller than the immediate previous look back period. Indicating weakening. Based on the CVD I would have been looking for a pullback or reversal which obviously did not happen. Price moved up consistent with the close above the EMA. The look back period is also quite short with CVD resetting what appears to be every 6-9 candles or so. I am missing something here. I can't quite figure it out. Can you provide more of an explanation concerning your use of CVD.
Thanks
My apologies
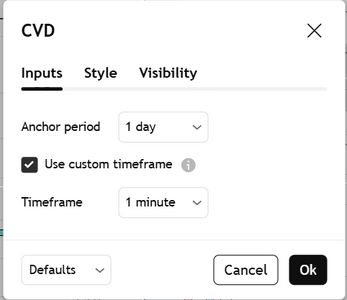
My settings were incorrect. I should not have been posting when feeling unwell. the first attachment below shows my correct settings
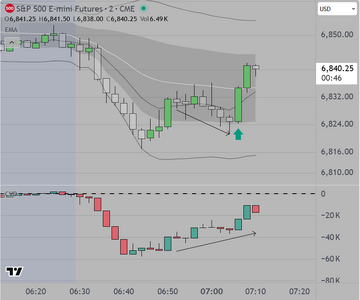
The second shows the 5 min chart with the entry within the time period we spoke of.
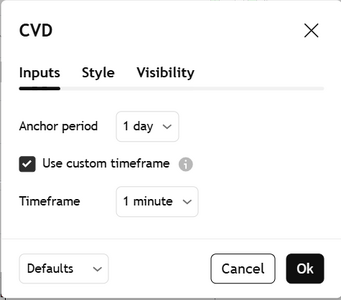
The anchor period is 1 day (resets every day)
and the time frame is 1 min which should provide adequate granularity for intraday trading a chart with 5 min bars
Please advise if this make the chart more readable for you
Attachments
Last edited:
Thank you. The updated settings make it easier to read.
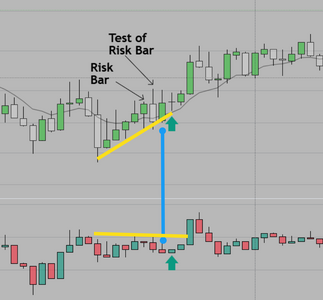
I can see one side gave up. But it is the opposite of what I would have expected based on the CVD which is confusing me.
I drew a few lines on the chart. The blue line between price and the CVD shows a green bullish price candle and a red bearish CVD candle, a divergence. I am not confident with these types of divergences on low timeframes. I do like them on the daily.
The yellow lines show a second stronger divergence between price and CVD. Again, I would not have gone long here. Based only on the CVD I may have considered a short position. Looking at the close above the EMA, a long signal, with the CVD a short signal, lack of confirmation between the two would have caused me not to take this trade. I would have waited. Granted CVD divergences are common all over the charts. I only consider them when there are other reasons to take a trade. A trade was taken here.
I looked through some of your posts in different threads. You seem to use the CVD different than I do. Can you review how you use the CVD.
Hope you are feeling better.
Attachments
Not trading today
And for anyone interested in my opinion. Don't trade when you are impaired
I can see that I am off. So I am standing aside at this point
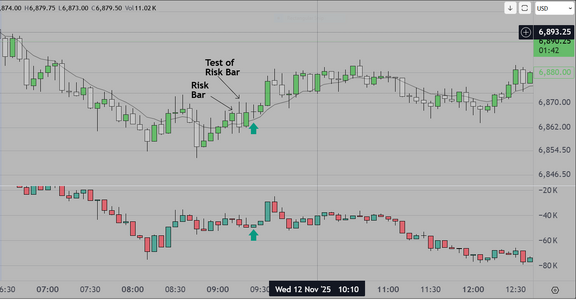
Posting 2 charts, the first is the Initial Read, which for me is the first possible entry
in what I call the "Buy Zone" which is near the bottom (prefer right at the edge of the 1st SD band
if possible on strong volume). A second entry would have been perfectly fine as price lifted above the
Black (9ema) on rising volume. The risk (Stop out) is below the previous bar (the tail of the previous bar).
And for anyone interested in my opinion. Don't trade when you are impaired
I can see that I am off. So I am standing aside at this point
Posting 2 charts, the first is the Initial Read, which for me is the first possible entry
in what I call the "Buy Zone" which is near the bottom (prefer right at the edge of the 1st SD band
if possible on strong volume). A second entry would have been perfectly fine as price lifted above the
Black (9ema) on rising volume. The risk (Stop out) is below the previous bar (the tail of the previous bar).
Attachments
Last edited:
To the person who started this thread, my apologies
The subject matter we are covering recently is not on topic
If you don't mind (everyone) those who are interested in my
commentary should switch over to the Thread
"A Professional Approach.....
And again I apologize I did not mean to take over this thread
The subject matter we are covering recently is not on topic
If you don't mind (everyone) those who are interested in my
commentary should switch over to the Thread
"A Professional Approach.....
And again I apologize I did not mean to take over this thread
BuddieBuddiee
Active member
- Messages
- 179
- Likes
- 7
hi again... I use GANN CIT dates...I trade SPX ( S&P 500) .. options. I ALSO enter DAILY the data on a free calendar I pick up from different companies. I know it's a crude method of doing what I'm doing...but it works (for me). am a VISUAL person -- want to see WHERE a PARTICULAR price has been -- a day low which many a times comes as a Day High and vice versa....and I look to see it in MY OWN HANDWRITING. more credible for me. right now am having some difficulty getting the snapshots onto my email and then processing it here/on other sites. ..so can't post the latest since July 2025..In the past I have been able to determine the potential trend moves using fibonacci clusters on medium to long-term charts. However, I seem to be struggling to identify the correct points where corrections usually tend to end with fibonacci clusters. In terms of corrections the fibonacci expansion tool which has been particularly useful in trends does not seem to provide much help with the 1.0 and 1.618 levels when combined with the retracement tool to create clusters of potential support or resistance zones. Could someone please suggest what a good way to identify strong support and resistance levels in a correction would be. I also tend to use volume for confirmation but would need to identify solid end of correction zones first I believe.
I look @ PREVIOUS months when a MONTHLY high & MONTHLY low happened ...
the price of 4835 was basically derived from approximate 1184 days from Jan 4th, 2022 MONTHLY "TOP" @ 4818.62
the 1184 days came from MICHAEL S. JENKINS --->
I won't overtake this pos/threadt started by you. am not certain if all of this is what you're asking/not.
Hi Steven,To the person who started this thread, my apologies
The subject matter we are covering recently is not on topic
If you don't mind (everyone) those who are interested in my
commentary should switch over to the Thread
"A Professional Approach.....
And again I apologize I did not mean to take over this thread
After your post about CVD I have been looking into it a little bit more. I am struggling to figure out how exactly to use it. The screenshot from below is the indicator that comes with TradingView. It does not look anything like the candlestick indicator that you are using. I did find one similar to your picture on TradingView but thought I would enquire first with you to see if you could direct me on the correct path on which indictor would be the most appropriate and how to use it. Any gudiance would be much appreciated.
Attachments

As mentioned in the previous post, please move your correspondence to
my primary thread, whose title is "A Professional Approach to Trading" so that we
can avoid hijacking this thread. As regards the Cumulative Delta Indicator I am attaching
a screen shot of my settings. If you are a trader who is struggling and want to improve
you might consider watching me trade on my LiveStream. I am working on that now and
hope to have it ready to go soon (next week). I specialize in trading the NY session of the
S&P Futures which begins in the early afternoon London time. If you monitor my thread
you will be able to obtain an invitation to join that meeting
Regarding the use of CVD (Cumulative Volume Delta), it would be a good idea to read about it
first, then to review my posts. The purpose of an indicator SHOULD be to help us improve our
result. To do that a person needs to understand what they are looking at, and how to interpret
it as it adds data to the screen. Otherwise, why use it?
Stay in touch
Good luck
Attachments
Last edited:
Similar threads
- Replies
- 1
- Views
- 6K
F
- Replies
- 4
- Views
- 4K
- Article
Technical Analysis
Why Successful Traders Use Fibonacci and the Golden Ratio
- Replies
- 15
- Views
- 9K